EKS Best Practices: A Free, Comprehensive Guide
Introduction- Introduction: EKS Best Practices: A Free, Comprehensive Guide
- Chapter 1: EKS Fargate: Features and Best Practices
- Chapter 2: AWS ECS vs. EKS: Comparison and Recommendations
- Chapter 3: A Free Guide to EKS Architecture
- Chapter 4: A Comprehensive Guide to Using eksctl
- Chapter 5: EKS Storage - A Comprehensive Guide
- Chapter 6: A Free Guide to Using EKS Anywhere
- Chapter 7: Fundamentals of EKS Logging
- Chapter 8: EKS Security: Concepts and Best Practices
- Chapter 9: How the EKS Control Plane Works
- Chapter 10: EKS Blueprints: Deployment and Best Practices
- Chapter 11: EKS Cost Optimization: Tutorial & Best Practices
Kubernetes and EKS have matured significantly over the last few years, with many standard practices
developing across the industry based on lessons learned from earlier mistakes. Best practices for EKS
build on the knowledge of Kubernetes-specific considerations and AWS-related standards. Following these
recommendations ensures that the clusters are designed according to well-known conventions, reducing
potential problems and improving the cluster management experience.
Summary of key concepts
| Security | Both Kubernetes and AWS provide many controls for maintaining a strong cluster security posture. |
| Scalability and high availability | EKS workloads should be designed to scale based on utilization and to survive partial outages without downtime. |
| GitOps and CI/CD | The GitOps model allows deployment to large cluster fleets, the tracking of infrastructure revision histories, change rollbacks upon failure, and audit changes by personnel. |
| Observability | Maintaining insight into cluster and workload behavior is critical to managing a production cluster. |
| Cluster version upgrades | Ensuring that EKS cluster versions maintain cadence with the upstream Kubernetes software release cycle is a challenge but provides significant benefits for administrators. |
| Tenancy | Kubernetes supports multiple tenancy models to allow administrators to effectively manage a wide range of workload types. |
Security
Security-related functionality has matured significantly for Kubernetes in recent years and provides
administrators with many options for securing production EKS clusters.
Security Layers
Security on EKS is a complicated topic due to the number of moving parts involved. Careful consideration
is required when designing and building EKS clusters to ensure that best practices are followed
rigorously.
Security best practices include the following:
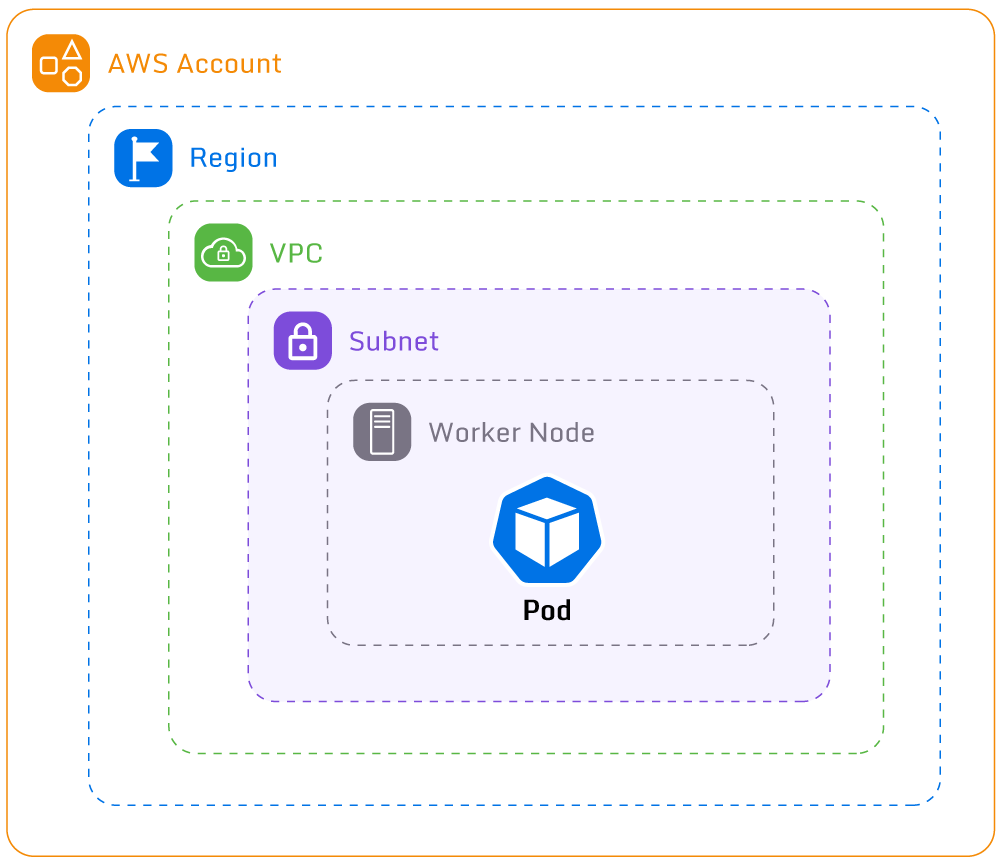
Restrict network access to the EKS cluster
This process involves locking down API endpoint access, worker node security groups, and network ACLs.
Preventing cluster access is the first line of defense for EKS. This page is a
good starting place for understanding the AWS EKS infrastructure security best practices.
Restrict credentials for EKS
This applies to both IAM and Kubernetes RBAC. Minimizing permissions granted via the aws-auth ConfigMap
and Kubernetes Roles/ClusterRoles will decrease the attack surface, following the “principle of least
privilege.” The goal is always to ensure that compromised credentials are a limited risk.
Block pods requesting high levels of access
Pods should have limited privileges to maintain cluster security, which means blocking those requesting
host filesystem, kernel capabilities, root user access, etc. These limits can be enforced through the Open
Policy Agent (OPA) project. OPA is an open-source tool that allows administrators to enforce
constraints on objects being deployed to the cluster by validating the object schema against a set of
user-defined rules and blocking access accordingly. The restrictions enforced by this tool can help
mitigate a compromised pod’s access to the worker node host.
Spend less time optimizing Kubernetes Resources. Rely on AI-powered Kubex - an automated Kubernetes optimization platform
Free 60-day Trial
Utilize native AWS features to improve EKS cluster security posture
This includes restricting IAM access, enabling EBS volume encryption, using up-to-date worker node AMIs,
using SSM instead of SSH, and enabling VPC flow logs. AWS provides extensive documentation on security-related options.
Restrict in-cluster network communication
Tools like Calico allow admins to
limit unwanted communication between pods, restricting the blast radius of compromised pods. Calico
allows administrators to define firewall rules restricting pod-to-pod communication via a resource type
called “Network
Policies.” Enforcing these rules ensures that pods only communicate with other pods when
whitelisted; otherwise, network traffic is denied. This ensures that if a pod is compromised, there will
be limits on what other pods it can attack via the cluster’s network.
Scalability and high availability
Ensuring that applications are scalable and highly available on EKS are done by leveraging
Kubernetes-native features and tooling. Scalability is an essential aspect of enabling an application to
be elastic, able to absorb growth in incoming request volume, and shrink when utilization becomes low.
High availability ensures an application’s ability to continue servicing requests during partial system
failures.
High Availability EKS Cluster
Following the best practices described below will improve the scalability and availability of workloads
on EKS clusters.
Configure all pods with readiness and liveness probes
Readiness and liveness probes are a built-in Kubernetes feature enabling automatic application health
checking, verifying that they are responsive, and terminating malfunctioning pods. This auto-healing
feature helps to maintain high availability by recovering automatically from pod-level failures. All
pods within a cluster should be configured with these probes to ensure that the cluster can recover from
intermittent failures automatically without administrator intervention.
Deploy all pod workloads with multiple replicas spread across multiple worker
nodes
This can be done via the Kubernetes Anti-Affinity feature, which causes pods to schedule automatically
across different worker nodes. Spreading pods across nodes ensures that a single node failure will not
impact all application pods.
Configure tools to scale the pod replica count
Tools like the Horizontal Pod Autoscaler or Keda can be configured to automatically scale the pod replica
count based on relevant metrics, like CPU usage or application request count. These tools can help
maintain an application’s elasticity, increasing the replica count when more resources are necessary and
downscaling when possible to reduce costs.
Apply appropriate resource requests/limits to every pod
Applying the appropriate resource request and limits to every pod can be complex without the right
tooling to complement the built-in functionality provided in Kubernetes known as Vertical Pod Autoscaling
(VPA).
The complexity with auto-scaling arises in three areas:
- The average user requests Kubernetes to reserve more CPU and memory for the containers that their
application requires. This excess accumulates over time causing resource waste. - Kubernetes auto-scaling features ignore IOPS and network bandwidth which can lead to performance
bottlenecks. - VPA uses a simple moving average using coarsely aggregated data to propose the values for requests
and limits. - VPA can’t effect changes “in place” meaning that it must first evict a pod and then recreate it
which makes the VPA “auto-mode” not viable for many applications. However, this shortcoming is being
addressed with the Alpha version of a feature being released in Kubernetes version 1.26.
Complementing Kubernetes auto-scaling with machine learning technology and a fine-grain analysis of
real-time capacity utilization will address these issues – you can learn more about these techniques here.
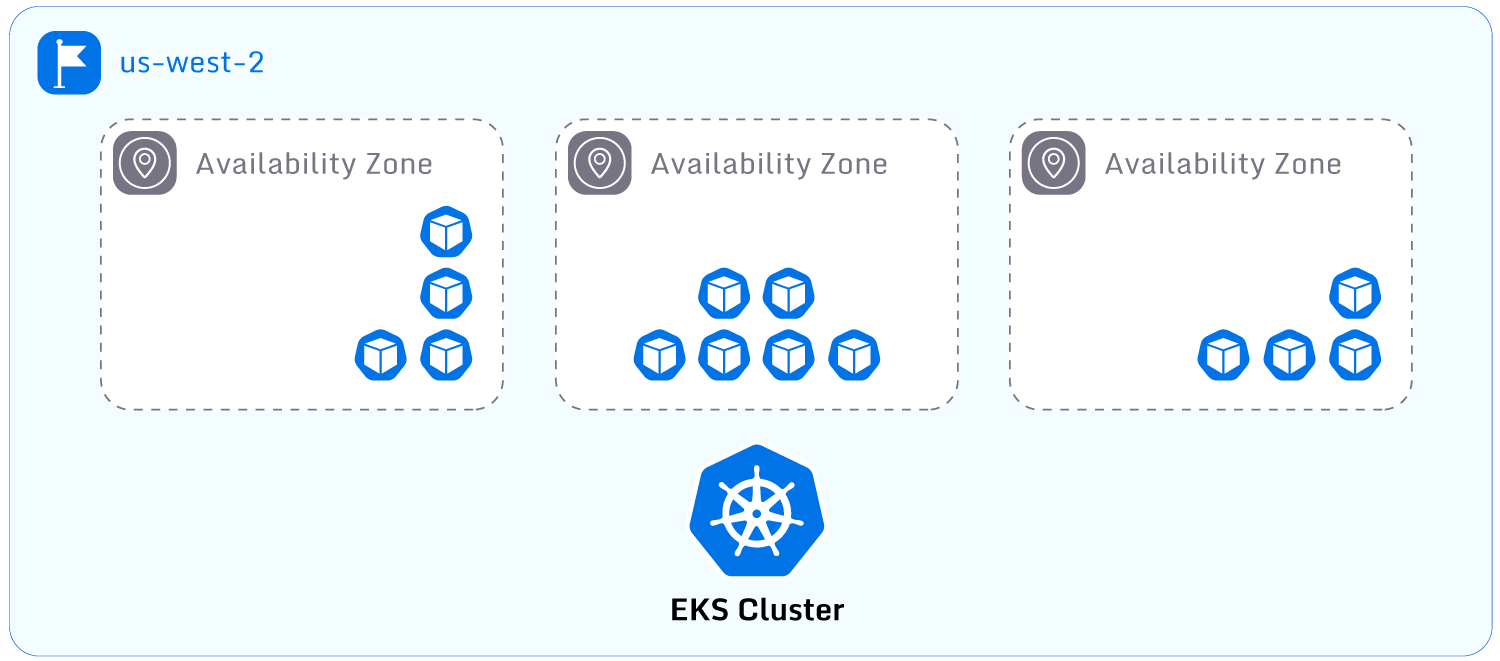
Configure worker nodes to deploy across multiple Availability Zones
Spreading worker nodes across zones ensures that a single zone outage will not cause a complete cluster
outage. Spreading worker nodes is done by implementing AWS AutoScalingGroups
across multiple Availability Zones.
GitOps and CI/CD
Spend less time optimizing Kubernetes Resources. Rely on AI-powered Kubex - an automated Kubernetes optimization platform
Free 60-day TrialGit is a version control system that stores change revision histories of primarily text files. It is
useful for storing application source code, Kubernetes resource manifests, and infrastructure
configuration files. GitOps is a model for using Git as a single source of truth for a cluster’s
configuration.
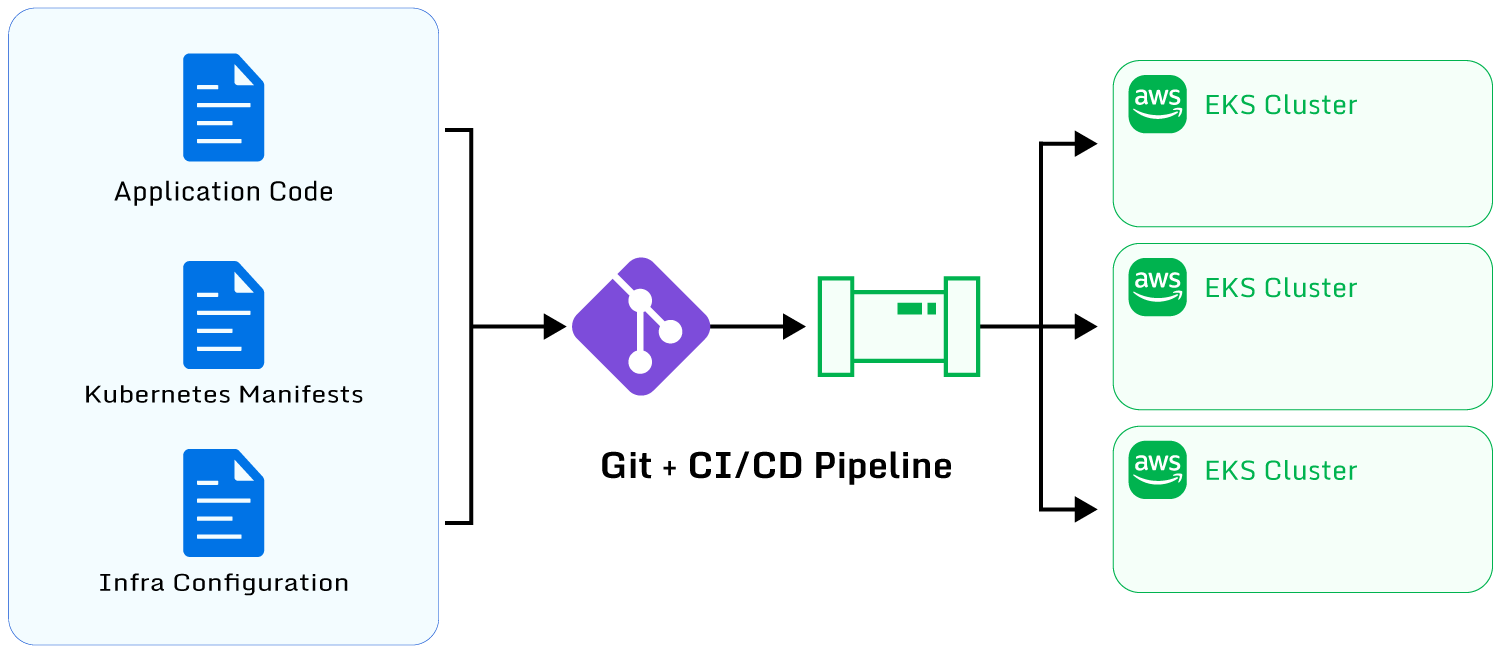
Implementing the GitOps model involves using Git to store all artifacts related to
the EKS cluster and leveraging tools like ArgoCD to scan and continuously deploy changes made to the Git
repository. ArgoCD is a CI/CD tool that can be installed into an EKS cluster to poll the remote Git
repository for changes. This combination of tools allows administrators to efficiently deploy changes to
large numbers of EKS clusters by simply pushing application source code, Kubernetes manifests, or
infrastructure configuration details to a Git repository. Changes will be reflected to clusters
automatically by ArgoCD.
This model allows administrators to deploy new changes quickly, roll out
to large fleets, maintain a simple single source of truth, track revision histories, roll back changes
on failure, audit changes by personnel, and use a single entry point for cluster configuration. GitOps
is the preferred model for modern Kubernetes/EKS cluster setups, especially for administrators managing
large cluster fleets.
Some specific best practices for implementing a GitOps workflow include the following.
Plan and document the Git repository structure layout
An intuitive and logical layout ensures that administrators can easily navigate the repository and make
appropriate changes. Dividing the repository into separate sections for application code, Kubernetes
resource manifests, and cloud infrastructure configuration is recommended. Admins will benefit from
dividing resources across multiple Git repositories for large or complex setups to improve organization.
Configure all cluster-related resources via infrastructure-as-code (IaC)
tools
Defining the infrastructure configuration as code using tools such as CloudFormation or Terraform allows
admins to leverage the benefits of a version control system. These include tracking changes to the
infrastructure over time, reviewing differences between revisions, rolling back to older configuration
versions, and replicating infrastructure consistently to different environments. EKS cluster
configurations can be fully defined via IaC, including the cluster control plane, node groups, AWS VPCs,
and other cloud provider resources.
Implement automation for the Git repository to perform validation on newly submitted
changes
This can include validating syntax correctness, checking for security best practices, checking for
deployment conflicts, and testing changes in a staging environment. Automated testing can help catch
problematic cluster changes before deploying to production environments. A benefit of using Git is the
ease of implementing automatic tests and validation mechanisms.
Observability
Ensuring system-wide visibility of all cluster components is essential for validating production
readiness, identifying bottlenecks, optimizing costs, ensuring security, and performing problem root
cause analysis. EKS supports a wide range of tooling related to observability, typically categorized
into three key observability pillars: metrics (e.g., Prometheus/Grafana), logging (e.g., CloudWatch and
FluentD), and tracing (e.g., AWS XRay and OpenTelemetry). This tooling provides administrators with
insight into their clusters, which is critical for production workloads.
The benefits of a high-quality observability setup are:
- Faster troubleshooting: This includes having access to observability data for
troubleshooting failures occurring within the cluster, including problems related to deployments,
application downtime, malfunctioning worker node hosts, control plane issues, AWS resource issues,
etc. Data availability allows administrators to quickly diagnose problems in EKS clusters. - Performance insights: Observability data provides insight into performance issues
experienced by applications running in the cluster. Insight regarding malfunctioning application
requests, host issues, latency and resource exhaustion can be critical to identifying performance
bottlenecks. - Forensic analysis: Identifying security breaches and impact requires observability
data for forensics. Observability data can provide insight into RBAC usage history, API server
requests, anomalies in worker node logs, container-related breaches, and more. - Cost optimization: Tracking cluster utilization with insight into every workload is
an important aspect of controlling unnecessary costs. Identifying cost-saving opportunities requires
analysis of observability data that provides insight into underutilized or overprovisioned worker
nodes, volumes, container resources, or other cluster objects.
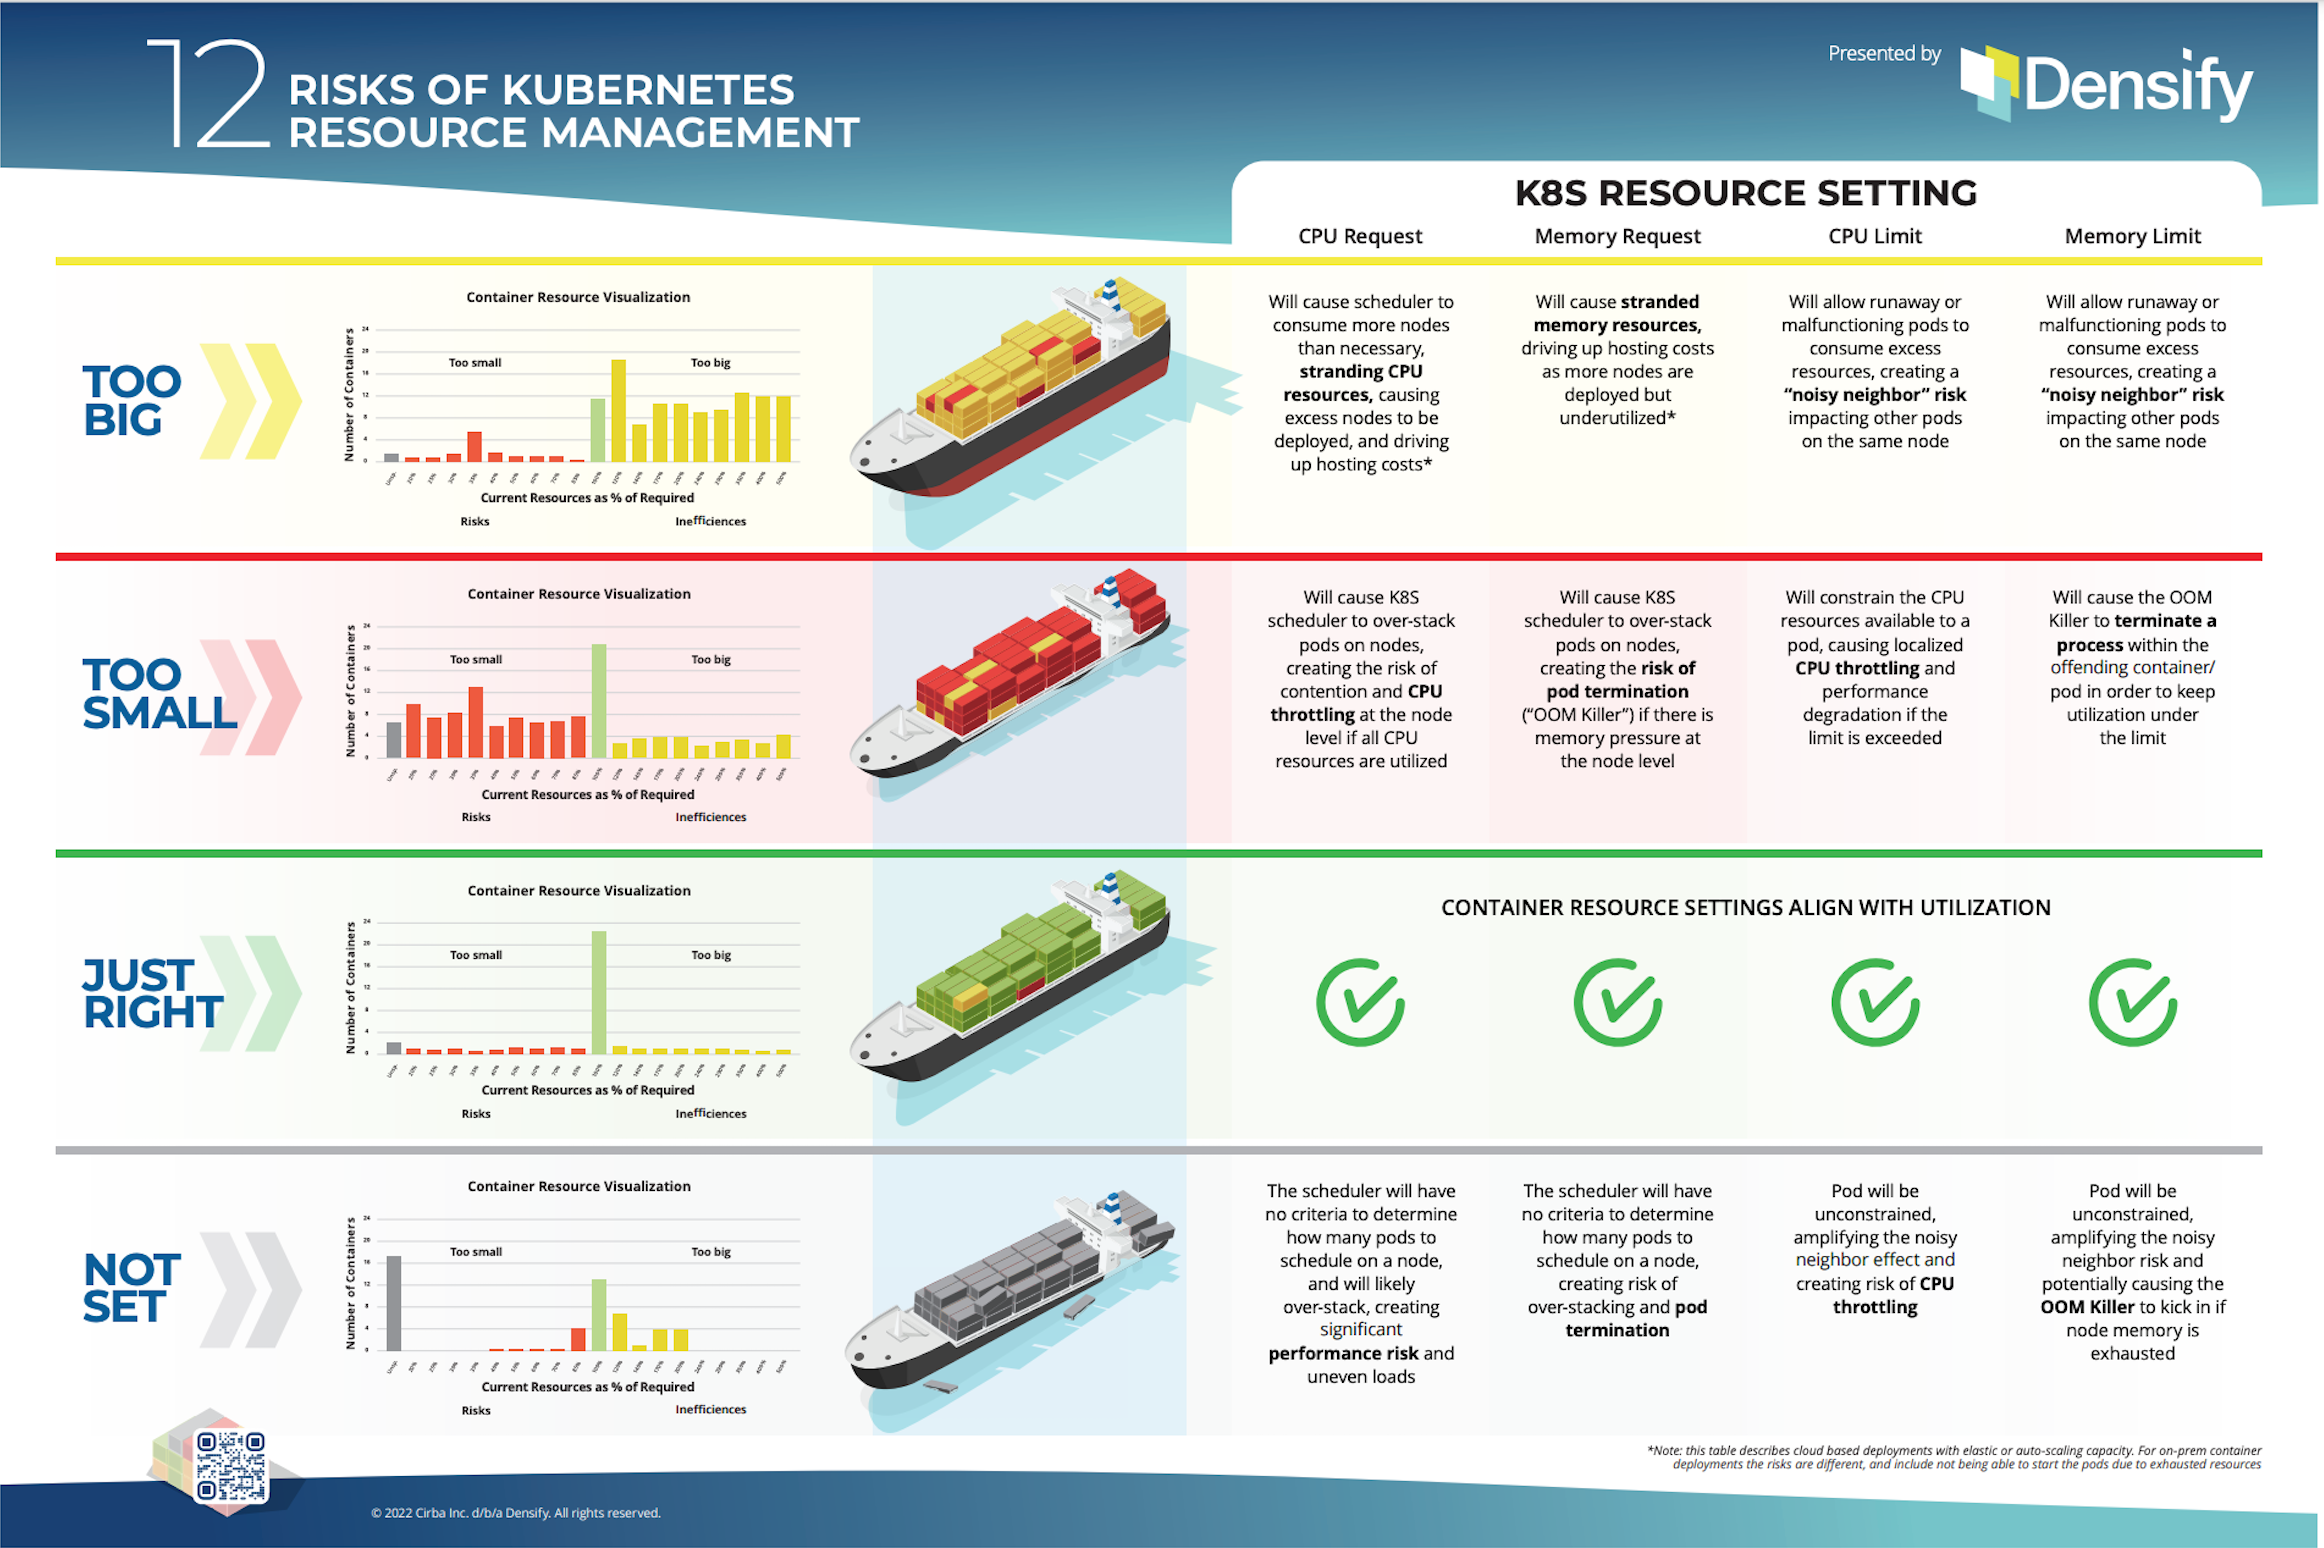
The challenge with cost optimization is that a simple estimation of CPU and memory utilization based on
observing 95 percentile watermarks ignores the short bursts that cause application performance
bottlenecks and also typically leaves out network and I/O usage measurements. As explained in this infographic,
overestimating CPU and memory requests and limits causes waste at the cluster node level, while
underestimating them can cause CPU throttling or pod termination, among other performance issues. Densify’s capacity optimization
solution leverages advanced algorithms to automatically set container resource requests and
limits based on a comprehensive analysis of all of the cluster resources.
Maintaining a high-quality observability setup is critical for managing a production cluster.
Observability best practices include the following.
Ensure that tooling is configured for metrics, logging, and tracing
Spend less time optimizing Kubernetes Resources. Rely on AI-powered Kubex - an automated Kubernetes optimization platform
Free 60-day TrialEach of these elements provides a unique view of cluster operations, and all are important to gather.
Deciding on which tools to implement for the observability pillars (metrics, logging, and tracing) will
depend on various factors, such as
- Which tools do the cluster administrators have expertise in?
- Which tools may already be standardized across the organization?
- Whether the cluster administrators prefer a managed solution versus an open-source solution.
To get a simple proof-of-concept of a metrics and logging setup running for testing purposes,
administrators may consider installing Prometheus, Grafana, and CloudWatch
Container Insights. These tools are simple to install, and will immediately collect and
aggregate cluster logs and metrics. Admins can compare the usability and features of each tool to
determine which fits their use case.
Tracing can be implemented on EKS via the OpenTelemetry
standard and AWS Xray. This setup enables the collection of cluster telemetry data, allowing
granular insight into application workloads.
There are many alternative tools available for implementing cluster observability. Choosing the ideal
tools will require administrators to clearly understand their use cases and requirements and to test
available options to validate their effectiveness.
Organize collected observability data for easy consumption
This can include practices like applying Prometheus Metric Labels, grouping logs and traces by category,
building high-quality dashboards, and developing documentation on how the observability setup works.
This approach will accelerate the research and investigation of cluster admins consuming the
observability data.
This exercise can also pay off in cost optimization. For instance, Densify
conveniently leverages Prometheus data to analyze resource consumption using advanced
algorithms.
Ensure that storage for metrics, logging, and tracing is highly available
This will mean either configuring the relevant tooling to store redundant data copies or utilizing
managed cloud services with built-in high availability. Managed observability solutions almost always
provide high availability by default. Deploying self-hosted solutions will require additional
configuration to ensure that storage is being replicated across nodes/zones.
Verify that all workloads deployed to the cluster are configured to expose
observability data
This can include exporting metrics, streaming application logs, and supporting request tracing to ensure
that the application is operating transparently. Cluster administrators will typically need to ensure
that developers deploying applications to the cluster are following software development best practices
like outputting application logs and exposing metrics. Enforcing these standards will ensure that
administrators can effectively expose observability data to better optimize cluster operations.
Cluster version upgrades
A new version of the Kubernetes project is released every four months, and the managed EKS service
follows this same cadence. Versions of Kubernetes more than four releases old are considered deprecated,
and EKS installations running older versions will be forcefully upgraded.
This fast-paced release cycle allows Kubernetes to publish new features and extend functionality quickly,
but it also challenges administrators to keep up with the software’s release cycle. Organizations
running production workloads on EKS are typically hesitant about making frequent changes that may impact
the stability of their applications.
Administrators also bear the operational overhead of upgrading EKS cluster control planes, worker nodes,
and installed components, running validation tests, reviewing change release notes, and actioning
roadblocks like version compatibility problems.
The operational overhead involved with upgrading EKS versions results in many organizations needing to
catch up to the recommended versions. This can cause several problems:
- There is a risk of a forced EKS upgrade executed by AWS on outdated clusters.
- Older cluster versions will miss out on newer features, security patches, and bug fixes.
- Older cluster versions will be incompatible with newer Kubernetes component versions. Running older
component versions will reduce access to new features, risk container vulnerabilities, and bypass
support that upstream maintainers provide (project maintainers will typically only support their
software on the latest Kubernetes versions).
Organizations benefit from prioritizing a smooth release pipeline for EKS version upgrades to mitigate
these challenges. The investment in a proper process and tooling will pay off via reduced operational
overhead, access to newer Kubernetes versions and included features, less time spent troubleshooting
compatibility issues, and the mitigated risk of a forced EKS version upgrade.
The best practices for maintaining a solid cluster version upgrade pipeline are as follows.
Ensure that all installed Kubernetes components are regularly updated
Spend less time optimizing Kubernetes Resources. Rely on AI-powered Kubex - an automated Kubernetes optimization platform
Free 60-day TrialWhether the components are installed using Helm Charts, Kustomize, or other tools, administrators must
regularly check for updates to maintain cluster version compatibility, access new component features,
and reduce security vulnerabilities. Keeping components up to date is key for mitigating cluster
upgrade-related compatibility issues.
Integrate cluster upgrades into regular sprint planning meetings
Use the version release calendar
provided by EKS to effectively plan for adopting new releases and viewing deprecation timelines.
Ensuring that cluster administrators have adequately planned the engineering resources required to
upgrade regularly will help maintain a consistent cadence.
Utilize observability data from tools like Prometheus and Grafana to monitor issues
in the upgraded clusters
Ensuring that observability tooling is in place will help quickly diagnose upgrade-related problems.
Observability data can provide greater confidence that an upgrade is working as expected by providing
insight into a cluster’s health.
Test workloads on staging clusters
Configuring deployment pipelines to run workloads on staging clusters running the upgraded versions will
help validate whether workloads are compatible with the latest Kubernetes releases.
Tenancy
Clusters may be utilized by various stakeholders, or “tenants,” which are stakeholders (like developers)
who deploy applications to the cluster. When there are many tenants consuming an EKS cluster, a tenancy
model should be implemented to ensure that each tenant is governed properly. Cluster tenancy models
describe how workloads are divided and segregated to enable effective cluster administration and a
high-quality developer experience.
Tenancy Models
clusters.
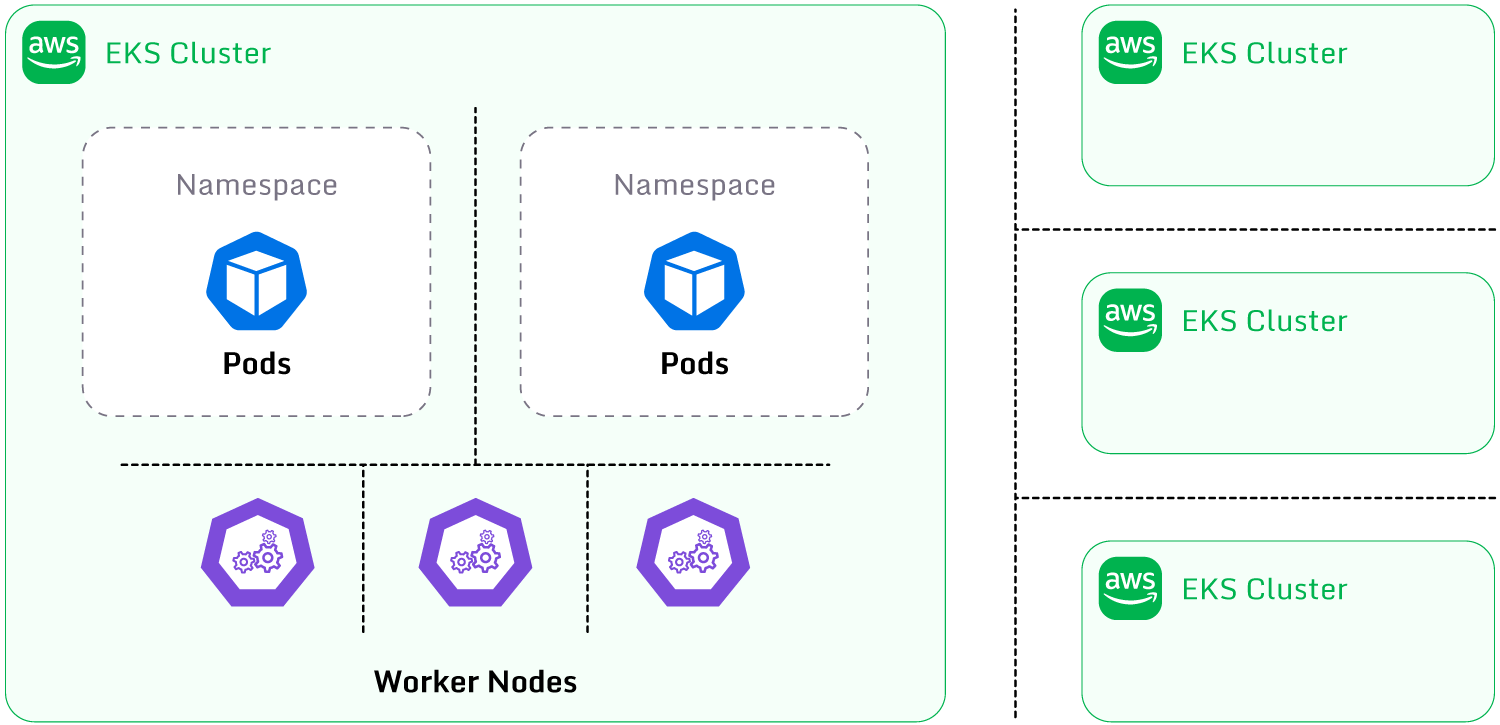
There are several standard tenancy models supported by EKS:
- Tenancy by namespace: Workloads are most commonly divided by namespace. Resources
deployed to different namespaces allow the utilization of Kubernetes namespace-related controls to
restrict permissions and resource usage granularly. Kubernetes namespaces are the most
straightforward approach to dividing resources into categories and managing them separately. - Tenancy by worker node: Kubernetes supports separating workloads into distinct
worker nodes to ensure node-level isolation between applications. Kubernetes features like affinity,
taints, and tolerations enable the scheduling of pods to specific worker nodes, allowing a high
degree of network and host isolation between workloads. - Tenancy by cluster: Managing tenancy by cluster involves segregating workloads
across multiple clusters. This option provides the highest degree of isolation between workloads and
allows complete customization of cluster configuration based on specific workload requirements. This
option will create increased operational overhead and potentially higher costs.
Determining which model to implement requires an analysis of user, security, and administration
requirements. Planning tenancy models carefully enables administrators to more efficiently manage
workloads with specific security, operations, or performance requirements. Ensuring the appropriate
solutions are implemented can reduce complexity and operational overhead in the long term.
Best practices regarding tenancy include the following:
Gather feedback and requirements from cluster tenants
Tenants who are utilizing the cluster (engineers, developers, etc.) may have useful feedback to help
determine whether existing cluster controls are sufficient for their requirements. A cluster is
typically designed as a one-size-fits-all solution, and some users may not suit the supplied cluster
configuration. Gathering feedback from all stakeholders is an essential aspect of iteratively improving
the cluster’s design.
Implement long-term resource planning to allow for cluster growth
Growing clusters will eventually need to be split into multiples to avoid hitting Kubernetes hard limits,
like the maximum number of allowed pods and worker nodes. Planning for multi-cluster tenancy solutions
early on will enable the growth of high-volume cluster workloads.
Analyze the security requirements of pod workloads
Differing security requirements indicate that workloads need to be split between distinct worker nodes or
clusters. Mixing workloads with varying security requirements is a poor practice.
Implement observability tools to gain insight into cluster workloads
Data on workload utilization will indicate when particular workloads should be moved to separate worker
nodes or clusters. For example, workloads frequently bursting to high CPU utilization may be better
served on dedicated worker nodes to avoid “noisy neighbor” problems for other workloads having their
resource access impeded.

Instant access to Sandbox
Experience automated Kubernetes resource optimization in action with preloaded demo data.
Instant access to Sandbox
Experience automated Kubernetes resource optimization in action with preloaded demo data.
