Fully Automate Kubernetes Resource Optimization
Eliminate human guesswork and manual effort
Slash Cost, Improve Reliability and Spend Less Time Managing
Legitimate understanding of your full stack and how each element impacts the other
Many solutions claim to be able to optimize but most will just make a mess because they don’t truly understand these interrelationships.
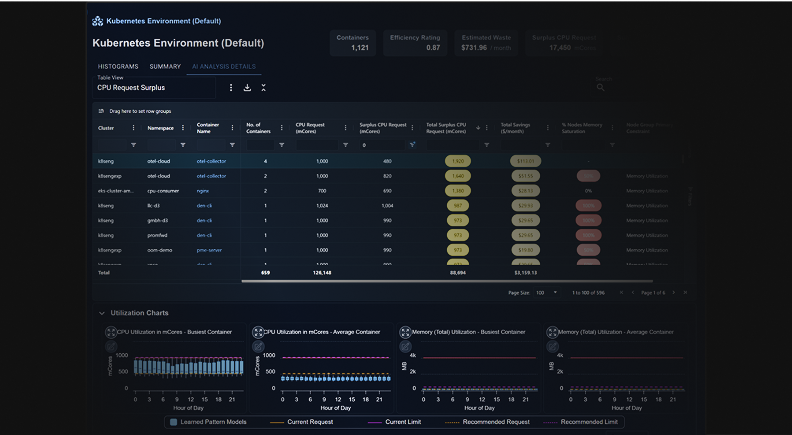
See past noise and risky changes to get to what matters: realizable gains
See top ranked risk and waste issues. The analytics are meticulous and high trust. You can automate recommended changes safely.
-
Automate using the most trustworthy recommendations on the market
Use Kubex’s Mutating Admission Controller or connect to the frameworks that you use already.
-
Easily share findings with others
Deep links direct to any data element or page in Kubex so you can direct attention to anything you want to share.
Optimize the Cost of GPU-Based Resources
-
Optimize GPU-Based K8s Nodes
Constantly optimize the GPU instance types underpinning node groups:
- Combine container optimization with unique cloud-level optimization to ensure the node types are optimal.
- “Full stack” approach models requested resources for AI/ML containers to simulate resource requirements at the node-level.
- Modeling of NVIDIA GPU types and policy-based control over which to use and what GPU-to-Memory ratios are optimal.
-
Track Node-Level GPU and GPU Memory Utilization
Track the aggregate node-level utilization of AI/ML workloads:
- Model the combined impact of all GPU-enabled and AI/ML containers scheduled on each node.
- Identify constraints and saturation points that can impact LLM performance, including factors impacting training duration and inference response time.
- Determine the effectiveness of GPU slicing algorithms, including time slicing, Multi-instance GPU (MIG), and.
- Multi-Process Service (MPS).
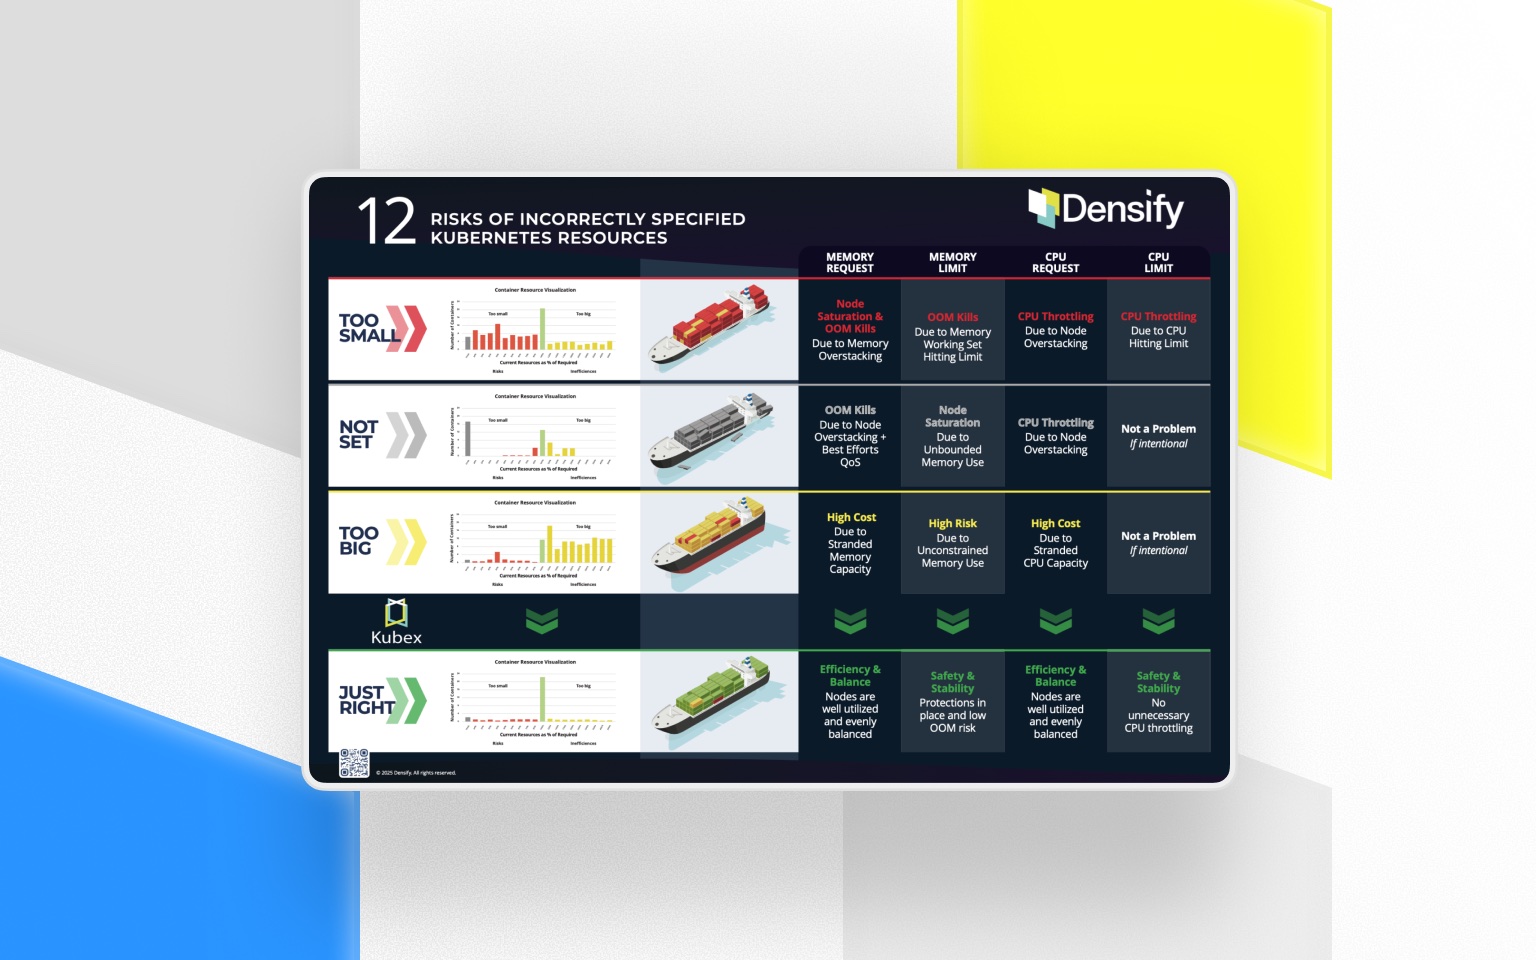
The devil is in the detail that other products just don’t see
-
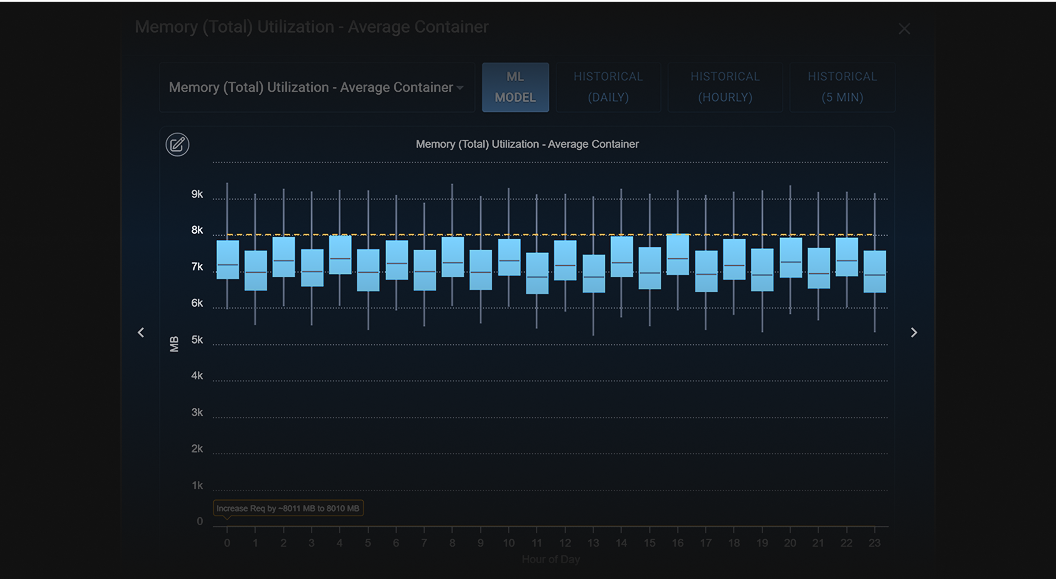
Machine learning of hourly patterns
Under every recommendation surfaced is a machine learned pattern that you can see by drilling in.
-
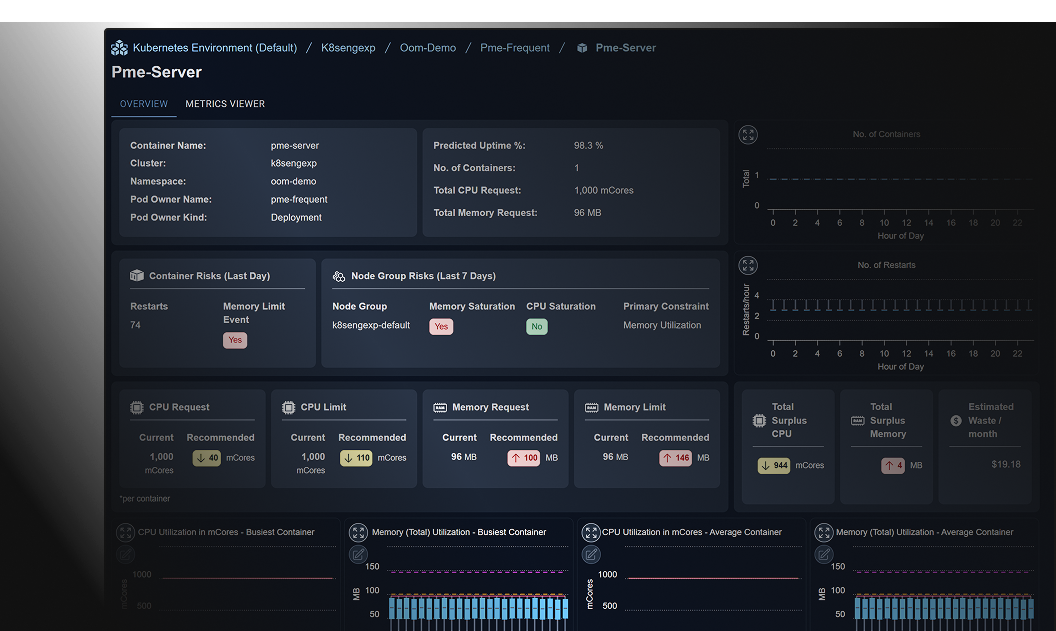
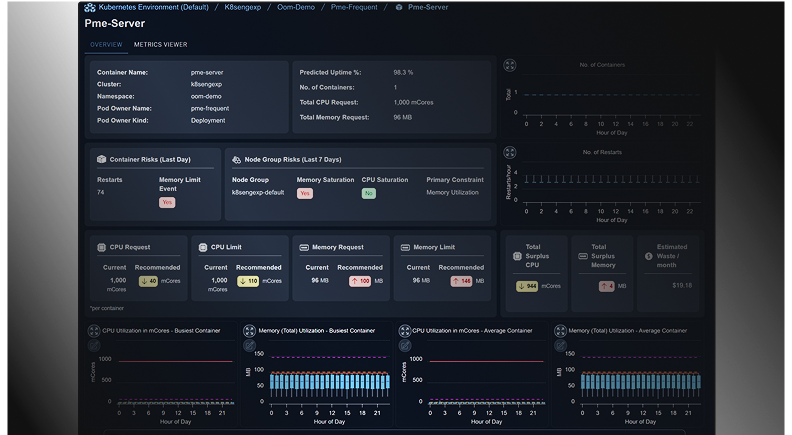
Historical daily patterns
Kubex has detected memory limit events and restarts and recommends increasing memory limits.
See the benefits of optimized
Kubernetes Resources
AI-driven analytics that precisely determine optimal resource settings for Kubernetes.
Frequently asked questions
What is Densify's Kubernetes Resource Optimization?
Densify’s Kubernetes Resource Optimization is an AI-driven analytics platform designed to fully automate the optimization of Kubernetes resources. It eliminates human guesswork and manual effort by providing precise, actionable recommendations for container and node resource settings.
How does Densify improve Kubernetes resource efficiency?
Densify analyzes the full stack—from containers to nodes to cloud instances—to ensure optimal resource allocation. It models requested resources for AI/ML containers, simulates resource requirements at the node level, and provides policy-based control over GPU usage and GPU-to-memory ratios.
What are the key benefits of using Densify for Kubernetes optimization?
Cost Reduction: Identify and eliminate resource waste, leading to significant cost savings.
Improved Reliability: Enhance application stability by preventing resource saturation and memory limit issues.
Automation: Implement trustworthy recommendations automatically using tools like Kubex’s Mutating Admission Controller.
Detailed Insights: Access machine-learned patterns and historical data to understand resource utilization trends.
How does Densify handle GPU resource optimization in Kubernetes?
Densify continuously optimizes GPU-based Kubernetes nodes by:
- Combining container optimization with cloud-level optimization to select optimal node types.
- Modeling NVIDIA GPU types and controlling GPU-to-memory ratios.
- Tracking aggregate node-level GPU and GPU memory utilization.
- Identifying constraints and saturation points affecting AI/ML workloads.
- Evaluating the effectiveness of GPU slicing algorithms like time slicing, Multi-Instance GPU (MIG), and Multi-Process Service (MPS).
Which platforms and environments does Densify support?
Densify supports a wide range of platforms, including:
- Kubernetes
- Red Hat OpenShift
- Amazon EKS
- Azure AKS
- Google GKE
- Nutanix Karbon Platform (NKP)
- Oracle OKE
This broad support ensures that Densify can manage resources across various clusters, namespaces, and individual containers.
How does Densify ensure safe and effective optimization?
Densify provides high-trust analytics by:
- Surfacing top-ranked risk and waste issues.
- Offering meticulous analytics that understand interrelationships within the stack.
- Allowing automation of recommended changes safely through integration with existing frameworks.
- Enabling easy sharing of findings via deep links to specific data elements or pages in Kubex.
How can I get started with Densify's Kubernetes Resource Optimization?
You can begin by booking a demo or exploring Densify’s sandbox environment to see the platform in action. Visit densify.com/trial
How do I set appropriate CPU and memory requests and limits?
Properly configuring resource requests and limits is crucial to prevent overprovisioning and excess cost or under provisioning, which can lead to wasted resources or application instability.
Best Practices:
- Capture historical usage patterns: Use metrics collected via Prometheus, Grafana, or other observability tools to establish a baseline of resource usage for each workload.
- Use solutions like Densify to determine the path to optimization: Precise optimization analytics can show you exactly where to make changes to optimize the environments safely
- Automate optimization: Once comfortable with analytics recommendations, enable automation in Densify to continuously keep the environment in an efficient state.
What are the best practices for autoscaling in Kubernetes?
Autoscaling helps maintain application performance and resource efficiency by adjusting resources based on demand.
Strategies:
1. Use Densify for Intelligent Rightsizing Recommendations
- Densify uses machine learning to analyze container usage metrics and recommends optimal CPU and memory settings per container or pod. For Kubernetes autoscaling:
- Start with Densify’s container-level recommendations: Before enabling autoscaling, ensure your containers are properly sized to avoid overprovisioning or premature scaling.
- Feed recommendations into Horizontal Pod Autoscaler (HPA): Adjust requests and limits based on Densify output so the HPA has accurate resource profiles to trigger scaling events effectively.
2. Integrate with Kubernetes Autoscalers (HPA, VPA, KEDA)
- Densify works best when its recommendations are used in conjunction with native Kubernetes autoscalers:
- HPA (Horizontal Pod Autoscaler): Densify provides baseline CPU/memory requests. HPA can then scale based on real-time metrics relative to those baselines.
- VPA (Vertical Pod Autoscaler): Avoid conflict with VPA if you’re already applying Densify’s recommendations manually or via pipeline—use one or the other for vertical scaling.
- KEDA: If you use event-driven workloads, Densify can still optimize resource requests to align with event-based scaling triggers.
3. Monitor and Tune Autoscaler Thresholds
- Densify can help identify if your current scaling thresholds are too aggressive or too conservative:
- Analyze scale-up/scale-down behaviors relative to the recommended “steady state” utilization.
- Tweak autoscaler thresholds and cooldown timers to reduce flapping or resource waste.
4. Focus on Cluster-Level Efficiency
- While Densify is strong at the container/pod level, it also enables cluster-level resource analysis:
- Optimize node group configurations to support typical pod size patterns.
- Avoid fragmentation and bin packing issues by aligning Densify’s pod-level sizing with available node instance types in your cloud provider.
How can I monitor and analyze resource usage effectively?
1. Data Collection via Telemetry Agents
- To monitor and analyze resource usage, Densify integrates with your Kubernetes environment through telemetry collection. This typically involves:
- Deploying the Densify Collector as a DaemonSet or sidecar across your cluster.
- Collecting key metrics: CPU, memory, and optionally disk and network I/O from pods, containers, and nodes.
- Ingesting data from Prometheus (or other sources) to supplement and cross-reference usage patterns.
- You don’t have to replace your monitoring stack—Densify can work alongside Prometheus, Datadog, or CloudWatch.
2. Deep Analytics on Historical Utilization
- Densify’s engine continuously analyzes historical usage data to:
- Identify usage patterns and peaks across containers, deployments, and namespaces.
- Assess seasonality and trends, which helps in environments with fluctuating demand (e.g., retail or ad tech).
- Generate optimal CPU and memory recommendations by learning what each workload truly needs.
- This is especially useful to avoid relying on worst-case provisioning and to fine-tune autoscaler thresholds.
3. Visualization and Reporting
- While Densify is not a replacement for tools like Grafana, it provides:
- Interactive dashboards for viewing optimization opportunities and current vs. recommended resource settings.
- Reports categorized by namespace, cluster, team, and application.
- Risk categorization (e.g., overprovisioned, underprovisioned, anomalous) to help prioritize remediation.
4. Continuous Feedback Loop
- The real power comes from integrating Densify’s insights into your operational flow:
- Feed Densify recommendations back into your CI/CD pipelines (Helm charts, Kustomize, Terraform).
- Combine with GitOps to enforce or review changes based on data-backed recommendations.
- Schedule periodic reviews or automate rechecks as part of sprint cycles or FinOps practices.
What are common resource management issues in Kubernetes?
Inefficient resource management can lead to performance bottlenecks and increased costs.
Common Issues:
- Overprovisioning: Leads to increased cloud bills and wasted resources due to excessive CPU/memory allocations.
- Underprovisioning: Results in slow application response times or crashes under load.
- Resource Contention: Occurs when too many pods are placed on a single node, competing for limited resources.
- Out-of-Memory (OOM) Errors: Pods may be terminated if they exceed their memory limits without warning, causing service interruptions.
- No Visibility: Without proper monitoring and tagging, teams may lose insight into which workloads or teams consume the most resources.