Fundamentals of EKS Logging
Chapter 7- Introduction: EKS Best Practices: A Free, Comprehensive Guide
- Chapter 1: EKS Fargate: Features and Best Practices
- Chapter 2: AWS ECS vs. EKS: Comparison and Recommendations
- Chapter 3: A Free Guide to EKS Architecture
- Chapter 4: A Comprehensive Guide to Using eksctl
- Chapter 5: EKS Storage - A Comprehensive Guide
- Chapter 6: A Free Guide to Using EKS Anywhere
- Chapter 7: Fundamentals of EKS Logging
- Chapter 8: EKS Security: Concepts and Best Practices
- Chapter 9: How the EKS Control Plane Works
- Chapter 10: EKS Blueprints: Deployment and Best Practices
- Chapter 11: EKS Cost Optimization: Tutorial & Best Practices
Introduction
Users should log several components of an Elastic Kubernetes Service (EKS) cluster to ensure easy operations, maintenance, and troubleshooting. An effective logging strategy will involve selecting the appropriate tools and validating that they meet user requirements.
This article will discuss how to enable logging for each component of an EKS cluster, what tools are available, and how they can be implemented to improve the operational readiness of EKS clusters.
Key concepts about EKS logging
| Why is logging important for EKS clusters? | Logging is important for production EKS clusters where log data is necessary to aid in troubleshooting problems, analyzing performance, investigating security incidents, and improving operational excellence. |
| What components of EKS can be logged? | EKS supports exporting logs from the control plane, EC2 worker nodes, Fargate nodes, and pods. |
| How can I enable EKS control plane logs? | EKS control plane logs must be manually enabled and will stream logs to AWS CloudWatch from master node components like the API Server and Kube Controller Manager. |
| How can I query EKS control plane logs? | EKS control plane logs are present in AWS CloudWatch and can be queried via the CloudWatch Log Insights tool. |
| How can I enable logs for EKS worker nodes and pods? | EKS supports the same logging tools as any other Kubernetes cluster, whether they are open-source, third-party services, or AWS-specific. Users can select any tool that fits their use cases. |
| How can I enable logging for EKS Fargate? | EKS Fargate supports logging via sidecar containers and via the built-in Fluent Bit log router. Either approach allows users to export log data from their Fargate pods. |
| How can I optimize EKS logging costs? | Excessive log expenses are mitigated by controlling how many logs are collected, excluding unnecessary log data, reducing log retention time, and optimizing log queries. |
Why is logging important for EKS clusters?
Logging is helpful for any environment hosting critical applications. Log data provides insight into the performance of applications and the underlying infrastructure. The data is essential for analyzing performance, identifying bottlenecks, troubleshooting bugs and unexpected behavior, detecting security breaches, maintaining uptime, and monitoring the environment’s health.
In the context of an EKS cluster, users will benefit from logs providing insights into the control plane, worker nodes, system pods, application pods, and surrounding AWS-related resources. Logging these components will give users deep insights into how the entire cluster behaves, ensuring that they can manage their clusters effectively.
What components of EKS can be logged?
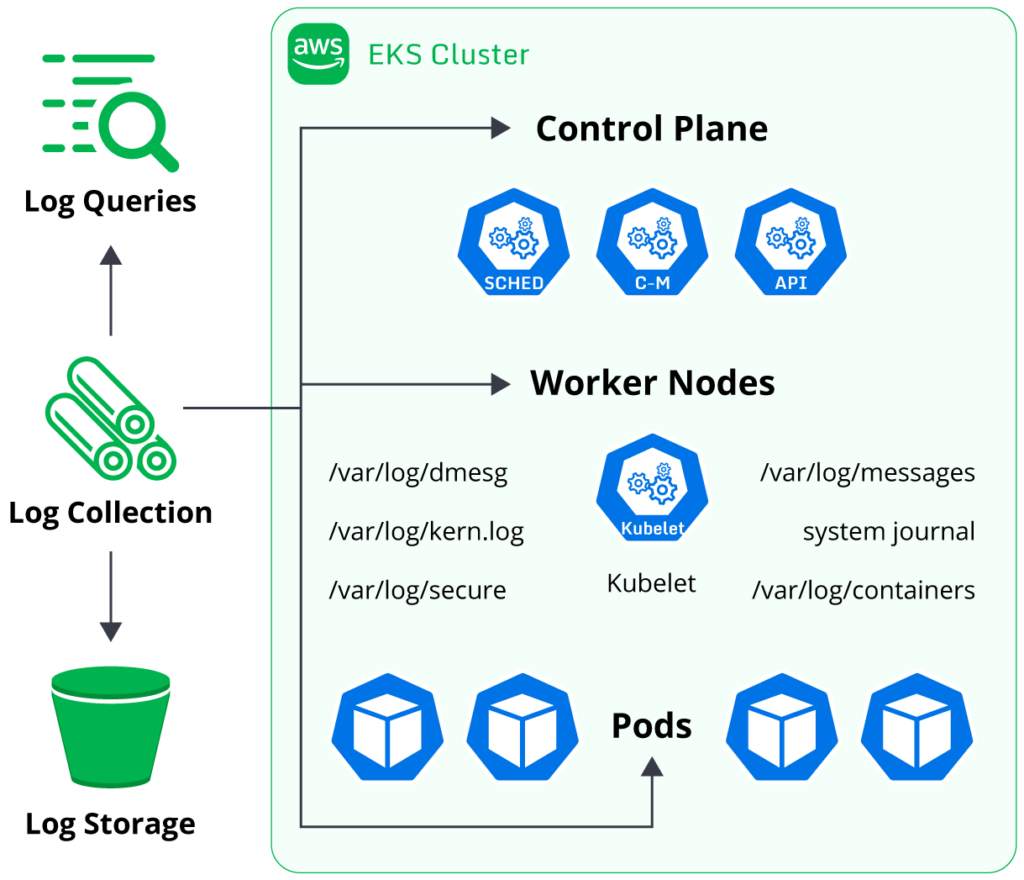
EKS clusters contain several different components that support logging. Users operating production clusters should consider configuring logging for each of these.
Control plane logs
As discussed further below, EKS provides a range of log streams generated by master node components (like the API Server and Kube Scheduler). Enabling these logs using the steps below will provide insight into cluster operations, including performance and security posture.
Worker node logs
The worker nodes in a Kubernetes cluster will generate system logs based on the operating system in use. Collecting the system logs will provide insight into the host’s performance and data, which is helpful in troubleshooting host issues.
Kubernetes-specific logs are generated by the kubelet agent, which is the agent responsible for communicating between the worker node and the control plane. The kubelet logs are typically stored alongside the operating system logs (e.g., the SystemD Journal on Linux) and should be collected to enable analysis of the kubelet’s behavior.
Pod logs
Each pod running in a Kubernetes cluster can produce log output; the contents of the output will depend on the application containers deployed. The application’s developer controls which log messages are output to stdout, and Kubernetes will fetch the logs accordingly when running kubectl logs <pod_name>. Users can collect these logs to enable application-level troubleshooting and diagnostics capabilities.
Spend less time optimizing Kubernetes Resources. Rely on AI-powered Kubex - an automated Kubernetes optimization platform
Free 30-day TrialCloudTrail logs
EKS clusters run on AWS infrastructure, and most AWS services will generate CloudTrail log event output. CloudTrail provides insight into API calls made to AWS services (e.g., EC2:RunInstance) and is a valuable tool for troubleshooting problems, auditing AWS resource access, and verifying the operational stability of AWS resources. A production EKS setup should include enabling CloudTrail logging to ensure that all AWS resources implemented for the cluster are logged. The log data is helpful for administrators managing EKS clusters.
Maintaining an effective logging setup for every aspect of an EKS cluster may appear daunting and complex to many users due to the number of components involved. However, implementing an appropriate logging setup will help improve the operational readiness of an EKS cluster, enable easier troubleshooting for future issues, allow more straightforward forensic analysis, and provide greater insight into performance bottlenecks. The payoff for proper logging is significant and will benefit many users.
How can I enable EKS control plane logs?
EKS provides the ability to forward control plane logs automatically to the CloudWatch Logs service. Logs from the control plane are disabled by default to mitigate unnecessary costs, but it is highly recommended that users enable the logs for production clusters where analyzing cluster operations is vital for administrators.
Control plane logs are enabled via the AWS web console or the AWS CLI tool.
Enabling logs via the CLI is done with the following AWS CLI command:
aws eks update-cluster-config --region region-code --name my-cluster --logging '{"clusterLogging":[{"types":["api","audit","authenticator","controllerManager","scheduler"],"enabled":true}]}'Users have a choice of which control plane logs to enable. Generally, users will enable all logs in a production environment, but those optimizing for cost may selectively enable the logs most relevant to user requirements.
The EKS control plane provides log data from several master node components:
- API Server: This is the primary entry point for requests sent to the EKS control plane. Log data from this component provides insight into request latency and volume, authorization history details, and helpful error messages.
- Audit: The audit log is generated by the API Server component but has a separate log stream for easier organization and configuration. The audit log provides insight into exactly what objects are being viewed or modified in the cluster and by which user. This data is helpful for examining changes to the cluster over time, enabling forensic analysis, and troubleshooting problems.
- Controller Manager: The Kube Controller Manager component will log data related to all control loops managing the cluster’s resources; for example, events associated with generating new pods due to applying a new deployment resource are logged. Log data from this component provides insight into many operations constantly occurring within an EKS cluster.
- Authenticator: This log stream is unique to EKS and not present in other Kubernetes distributions. The Authenticator log is generated by the IAM Authenticator component running in the EKS control plane and logs data for each IAM principal’s authentication request. Cluster users will authenticate to EKS clusters via IAM users and IAM roles, and the Authenticator is responsible for mapping the IAM principal to a Kubernetes RBAC resource (users, groups, or service accounts). The log data from this component provides insight into which IAM principals are accessing the EKS cluster and what RBAC resources they are utilizing.
- Scheduler: The Kube Scheduler component assigns pods to worker nodes in a Kubernetes cluster. The Scheduler will log data on how the algorithm calculates which nodes to utilize depending on factors like available capacity, taints, and affinity rules. Log data from this component provides insight into scheduling decisions made by the Kube Scheduler and is relevant for troubleshooting issues related to unexpected scheduling decisions.
The EKS control plane log data provides extensive insight into the cluster’s activities. The data is crucial for administrative operations like troubleshooting issues and forensic analysis, so all users should enable these logs when operating production clusters.
Spend less time optimizing Kubernetes Resources. Rely on AI-powered Kubex - an automated Kubernetes optimization platform
Free 30-day TrialHow can I query EKS control plane logs?
EKS control plane logs are exported to the CloudWatch Logs service. CloudWatch Logs supports a tool called Insights for querying and analyzing log data, which is used for querying the EKS control plane logs.
To query the control plane logs for a particular EKS cluster, users will need to open the Insights tool:
- Open the CloudWatch web console.
- Select Logs -> Log Insights in the navigation menu.
- You will see many log groups listed here, including one for your EKS cluster. Open the log group containing your EKS cluster’s name.
- Run one of the queries below to analyze data from your EKS cluster.
Query examples
Discovering useful log queries is very helpful for investigations, troubleshooting, and diagnostics purposes. Storing successful queries in a document is a common practice for users who use CloudWatch Log Insights often. Saving important queries saves time in the future and makes it easier to customize existing queries for new purposes.
The CloudWatch Log Insights query syntax can be found here.
Query which IAM principals have accessed the “kubernetes-admin” RBAC user
This user has unlimited permissions to modify the cluster, and its access is heavily restricted as a best practice. Monitoring its actions is useful for investigating potential security incidents. The query can be modified to investigate which other RBAC users are being accessed by IAM principals.
fields @logStream, @timestamp, @message
| sort @timestamp desc
| filter @logStream like /authenticator/
| filter @message like "username=kubernetes-admin"
| limit 50
Query what actions were performed by the “kubernetes-admin” RBAC user
Following on from the above, investigating exactly what actions were performed by this privileged user in the EKS cluster is useful for securing a cluster.
fields @logStream, @timestamp, @message
| filter @logStream like /^kube-apiserver-audit/
| filter strcontains(user.username,"kubernetes-admin")
| sort @timestamp desc
| limit 50
Query which API Server requests resulted in 5XX errors
Analyzing this data is useful for troubleshooting potential issues occurring in the EKS control plane or misconfigured requests being performed by clients.
fields @logStream, @timestamp, responseStatus.code, @message
| filter @logStream like /^kube-apiserver-audit/
| filter responseStatus.code >= 500
| limit 50
Spend less time optimizing Kubernetes Resources. Rely on AI-powered Kubex - an automated Kubernetes optimization platform
Free 30-day TrialQuery which RBAC User deleted a particular pod
Queries like this are useful for determining which users accessed or modified a particular resource. Simply modify the “verb” and “requestURI” to perform a range of useful queries related to auditing and root cause analysis.
fields @logStream, @timestamp, @message
| filter @logStream like /^kube-apiserver-audit/
| filter verb == "delete" and requestURI like "/api/v1/namespaces/default/pods/my-app"
| sort @timestamp desc
| limit 10
There are many more types of CloudWatch Log Insights queries available for users. Learning the basic syntax for performing queries will yield many benefits for cluster administrators, especially for the troubleshooting and analysis of cluster behavior.
How can I enable logs for EKS worker nodes and pods?
EKS supports various logging tools provided by AWS, third-party companies, and open-source communities. These tools typically run as software installed on the worker nodes, allowing them access to collect and export node and pod logs to the destination log storage service.
Open-source solutions
All open-source tools enabling log collection for Kubernetes clusters are supported by EKS. Examples of open-source logging tools include Grafana Loki, Logstash, and FluentD. These are all big projects with large user bases and developer communities.
Open-source projects provide a high degree of flexibility and many features at low cost. A key drawback of open-source logging tools is the operational overhead of configuring log storage, though. Proprietary solutions typically manage the operational burden of supplying redundant, highly available, and scalable storage backends for log storage. Open-source projects like Grafana Loki involve self-hosting the log storage, which requires additional operational overhead for the user.
Users will need to evaluate their use cases to determine whether self-hosting their logs is a worthwhile trade-off for an open-source project’s improved flexibility and community support.
Proprietary logging solutions
Companies like SumoLogic, DataDog, Splunk, and New Relic provide managed solutions for log streaming and storage. Users already implementing these types of services in other environments may choose to adopt the same solutions in their EKS clusters for consistency. Managed solutions will cost more than open-source equivalents and may provide reduced feature sets. However, they will handle the operational overhead of log storage, redundancy, and scaling.
AWS
The in-house cluster logging solution provided by AWS is called CloudWatch Container Insights. AWS’s approach to enabling cluster logging involves exporting logs to AWS CloudWatch, a service allowing the storage and analysis of logs and metrics.
Making the right choice
Determining which of the logging solutions above to implement will depend on various factors. Users will have to take into account the following:
- What tools are they comfortable and familiar with using?
- What is their tooling budget?
- How much operational overhead or engineering time are they willing to invest in maintaining a logging setup?
- What specific features of a logging setup does their use case require? For example, are there requirements related to throughput, log volume, storage redundancy, compliance, etc.?
These questions will help users narrow down the ideal logging solution for their use cases. As with all tooling, the best way to find the appropriate one is to test and validate various options. Experimentation will provide data on which tools fit requirements and which are inadequate.
AWS users with simple requirements and no exceptional use cases typically default to implementing CloudWatch Container Insights. This is appropriate for users who are already comfortable using CloudWatch and may already be using it to store logs/metrics from other AWS services. Container Insights is a good starting point for a logging solution, and it is easy to migrate away from if a user eventually decides to switch the logging solution to another provider.
Spend less time optimizing Kubernetes Resources. Rely on AI-powered Kubex - an automated Kubernetes optimization platform
Free 30-day TrialAWS provides a Quickstart Solution that contains all the relevant manifests for enabling Container Insights and deploys the following setup:
- FluentD: A Kubernetes DaemonSet containing FluentD pods is deployed. These pods are configured to collect logs from other resources in the cluster. FluentD can be configured via a Kubernetes ConfigMap to control specifically which logs to aggregate, how to label them, what to exclude, and the log format. FluentD will default to collecting logs from all pods, worker nodes, and the kubelet agents.
- CloudWatch agent: The CloudWatch agent reads the logs collected by FluentD and exports these logs to the CloudWatch service. The agent is installed as a DaemonSet, just like FluentD, which means a pod runs on every worker node.
- IAM Policy: The CloudWatch agent needs IAM permissions to push logs to the CloudWatch service.
The complete installation procedure is located here.
Users will benefit from experimenting with various logging solutions to gather data on which ones meet their requirements.
How can I enable logging for EKS Fargate?
EKS Fargate is a serverless compute feature available for EKS users. Deploying pods to Fargate allows users to delegate the management of worker node compute hosts to AWS. This enables users to mitigate the operational overhead of managing a fleet of EC2 instances.
Pods deployed to Fargate are still capable of exporting log data. However, since AWS manages the underlying compute host, there are fewer options available for configuring log streaming.
The two options for enabling logging for EKS Fargate pods are sidecar containers and the Fluent Bit log router.
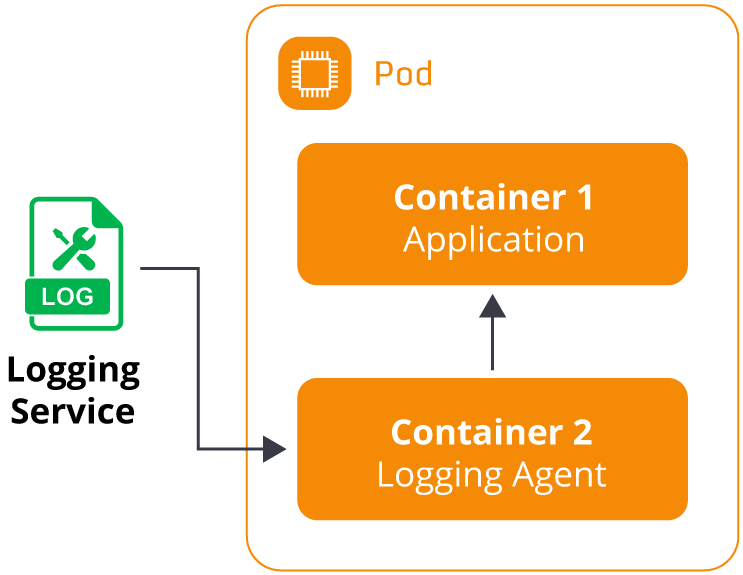
Sidecar containers
A sidecar container is a secondary container defined in the pod schema. A pod can define multiple containers to run collectively on the same host.
Implementing sidecar containers helps enable additional functionality for the primary application pods. For example, they can be used to include network proxies, service meshes, and log routers. A typical pattern for EKS Fargate users is to include a sidecar with a logging solution like Fluent Bit or DataDog to capture logs from the primary container and forward them to a destination service. This pattern provides the flexibility of using almost any logging agent (open-source, AWS native, or third-party) for Fargate pods. However, there is added complexity in modifying every Fargate pod’s schema to include an additional container with the logging agent. This can result in significant complexity and overhead in clusters with large numbers of Fargate pods.
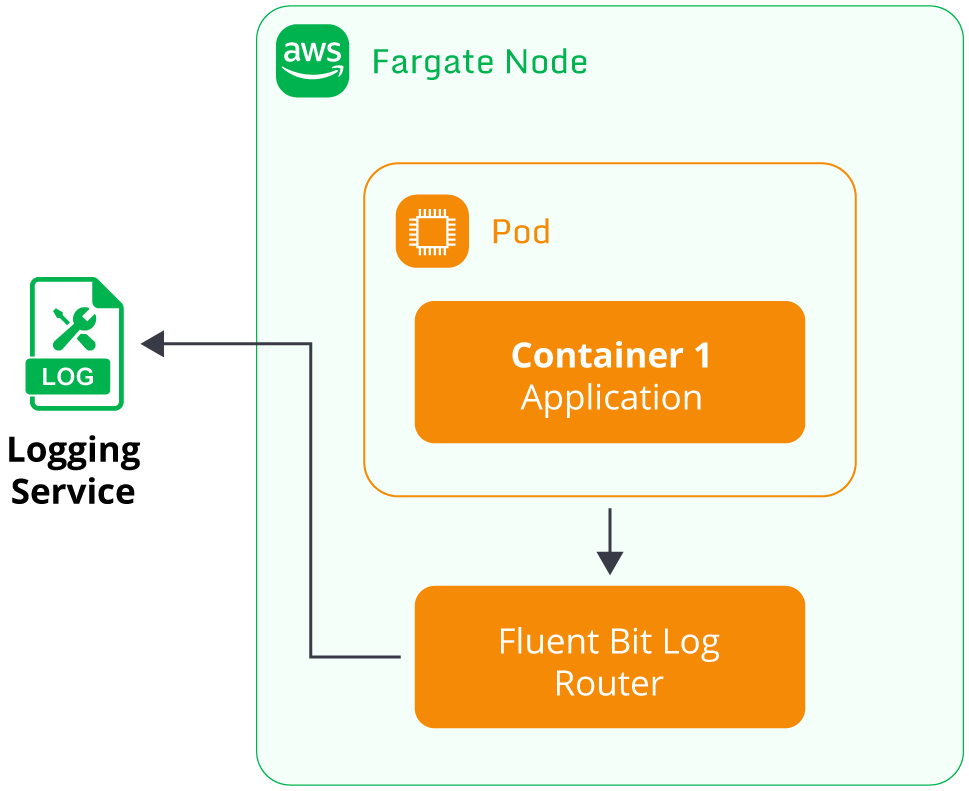
Fargate Fluent Bit log router
The sidecar container solution used to be standard for users to implement on Fargate. However, based on user feedback regarding the complexity of managing sidecar logging containers, AWS provided an alternative solution to simplify the logging setup for users.
EKS Fargate nodes now include a built-in log router based on the open-source Fluent Bit project. The log router is transparently installed by default on the underlying Fargate node, so users do not need to include a sidecar container for log routing. Users let the Fluent Bit router manage log streaming automatically for their application pods. The Fluent Bit log router deployed by AWS is capable of streaming Fargate pod logs to a variety of AWS services, including:
- CloudWatch Logs
- OpenSearch
- S3
- Kinesis
Streaming logs to third-party providers like SumoLogic and DataDog is not supported. Use cases requiring third-party log providers are better suited to EC2 worker nodes than Fargate.
Three key steps are required to enable Fluent Bit logging for Fargate nodes:
- A ConfigMap called aws-logging is created to define the logging configuration. Parameters such as the destination AWS service, log filters, retention time, and log group name are defined here.
- The ConfigMap must be deployed to a fixed Kubernetes namespace called aws-observability. This specific namespace is where Fargate will search for the aws-logging ConfigMap.
- The pod running on Fargate must be configured with an IAM role capable of accessing the destination log service. For example, if the log stream destination is CloudWatch Logs, the IAM role must have an IAM policy allowing access to CloudWatch Logs.
The setup process for Fargate logging via Fluent Bit can be found here.
How can I optimize EKS logging costs?
Implementing logging for EKS clusters will incur varying costs depending on the configuration setup. Logs will typically involve expenses for data transfer from the EC2 instances (worker nodes), storage, and log queries. The exact cost will depend on what log service is implemented.
Users can prevent high and unexpected costs by configuring their logging setups appropriately. Log configuration details that will have a significant impact on costs include the following:
- Which pods are selected for logging: Large clusters with high volumes of running pods will produce a significant log volume. Logging agents can be configured to selectively log relevant pods only; for example, pods deployed for testing purposes may not need to be exported to external services since
kubectl logs <pod_name>may be enough for testing purposes. - Which logs are filtered out: Not all log messages generated by pods are helpful for future analysis, so log agents typically include features for ignoring log messages containing specific keywords or labels. Implementing this type of filtering will help reduce noise from irrelevant logs and reduce ingestion costs accordingly.
- Duration of log storage: Storing data always costs money, and keeping high-volume log data with unlimited retention may be unnecessary. Reducing log retention time to only what is necessary will help mitigate costs.
- Scoping log queries appropriately: Log queries are often priced based on how many logs were scanned for a result. Performing queries without specific filters and timeframes will result in higher costs than performing more granular searches on specific log subsets.
For CloudWatch Container Insights, pricing details for log ingestion, storage, and querying can be found here.
Summary of key concepts
Configuring a thorough logging setup is crucial to operating a production EKS cluster. Log data enables users to investigate every aspect of cluster behavior, troubleshoot problems, analyze performance, diagnose security issues, and optimize operations.
Log data is readily available from every component of an EKS cluster, including the control plane, worker nodes, pods, and AWS API events. Collecting and storing this data will be beneficial in the long term. However, the initial configuration will require time and effort to accurately determine what approach will suit the user’s use case.
Identifying the appropriate logging strategy will require testing and validation. Experimenting with various tools and services will provide greater confidence in logging strategy choices and help with validating the selected approach.
FAQs
What is EKS logging and why is it important?
EKS logging refers to collecting logs from the control plane, worker nodes, pods, and AWS infrastructure to monitor and troubleshoot Kubernetes clusters. Strong EKS logging practices improve reliability, security, and operational efficiency.
How do I enable control plane logs in EKS?
Control plane logs are disabled by default but can be enabled through the AWS console or CLI. Once enabled, logs such as API, audit, authenticator, controller manager, and scheduler streams are sent to CloudWatch Logs.
What tools can be used for EKS logging?
EKS supports AWS-native solutions like CloudWatch Container Insights, open-source tools such as FluentD, Fluent Bit, and Grafana Loki, and third-party services like Splunk, Datadog, or Sumo Logic. The best choice depends on budget and operational needs.
How does EKS logging work on Fargate?
Fargate pods support logging either via sidecar containers running log agents or through the built-in Fluent Bit log router. Fluent Bit automatically streams logs to AWS services like CloudWatch, S3, or OpenSearch.
How can I reduce EKS logging costs?
To optimize costs, selectively log only necessary pods, filter out irrelevant log messages, shorten retention periods, and scope queries to smaller datasets. This prevents excessive ingestion, storage, and query charges.
Try us
Experience automated K8s, GPU & AI workload resource optimization in action.
Try us
Experience automated K8s, GPU & AI workload resource optimization in action.