Guide To Kube-State-Metrics
Guide to Kubernetes Tools May 12, 2021
 Kubernetes for production use requires constant monitoring of two key component variables:
- Health and resource usage.
- Internal object states.
In this article, we’ll talk about how kube-state-metrics can satisfy the needs of monitoring component object states, how it differs from metrics-server, and how to use the tool as part of a stack to build highly consumable data visualizations.
What is Kube-State-Metrics?
Kube-state-metrics is a listening service that generates metrics about the state of Kubernetes objects through leveraging the Kubernetes API; it focuses on object health instead of component health. This exposes useful information about node statuses, available deployment replicas, pod lifecycle statuses, certificate signing request statuses, and more.
Kube State Metrics vs Metrics Server
The Metrics Server, which often comes pre-installed on cloud clusters, is a service that might seem similar to kube-state-metrics at first glance. However, there are a few key differences:
| metrics-server | kube-state-metrics |
|---|---|
| Shows resource utilization of objects (CPU/memory) | Shows state of objects (up/available/deleted etc.) |
| Applies heuristics for easier understanding | Displays raw data from Kubernetes API |
| Serves data in the Metrics API format | Serves data in the Prometheus exposition format |
Since kube-state-metrics serves data using Prometheus’ exposition format, metric visualization and analyzing is easy to set up with Prometheus without too much integration work.
Overall, both the metrics-server and kube-state-metrics tools are essential for day-to-day cluster operations.
How Kube-State-Metrics Gathers Data
Kube-state-metrics talks with Kubernetes clusters using client-go, a Kubernetes API client in golang. It takes a snapshot of the entire Kuberentes state, uses that in-memory state to generate metrics, and then serves them on the /metrics endpoint.

Kube-state-metrics gets raw data directly from the Kubernetes API, and does not apply any modifications to the data it exposes. This means that the data is:
- Exhaustive to the native objects in Kubernetes.
- Comprehensive (it covers most of the useful important metrics in the cluster).
- Available to be transformed according to the needs of the cluster operator (no additional pre-modifications are done before being served on the endpoint).
Metrics Available
Kube-state-metrics exposes several data points to its endpoint. These are the most important to remember:
Nodes
| Metric | Description | Use Case |
|---|---|---|
| Node Labels | The labels attached to a node. | Used for displaying label information per node. |
| Node Taints | The taint of a node in the cluster. | Used to see how many nodes per node taint for advanced pod scheduling. |
| Node Status Capacity | Resources Capacity for the node (cpu/storage/pods). | Used to monitor the state of new nodes coming up during an autoscaling event. |
| Unschedulable | If a node can schedule pods. | Useful for monitoring progress of a node update. |
| Condition | If a node is available or not. | Useful to diagnose if pod scheduling events are being disturbed by prevailing node conditions. |
Spend less time optimizing Kubernetes Resources. Rely on AI-powered Kubex - an automated Kubernetes optimization platform
Free 60-day TrialDeployment Metrics
| Metric | Description | Use Case |
|---|---|---|
| Available Replicas | How many replicas are currently running and accepting traffic. | Used to monitor if the deployment has the right number of replicas as expected. |
| Unavailable Replicas | Replicas currently not accepting traffic. | Used to monitor how many replicas are not available, during an update or during a disruption event. |
| Rolling Update Strategy Max Unavailable | How many replicas can be made unavailable during a rolling update. | Used to check what the deployment specification is for a rolling update. |
| Rolling Update Strategy Max Surge | How many extra replicas can be scheduled over the configured number during a rolling update. | Used to check what the deployment specification is for a rolling update. |
Stateful Set Metrics
| Metric | Description | Use Case |
|---|---|---|
| Replicas | Number of replicas in the statefulset. | Used to see if the number of replicas observed matches the number required. |
| Replicas Ready | The number of replicas which are ready. | Used to see how many replicas are accepting traffic during an update or disruption event. |
| Replicas State | State of each replica in statefulset. | Uses to see what the current state of each replica is for monitoring general health of an application. |
Spend less time optimizing Kubernetes Resources. Rely on AI-powered Kubex - an automated Kubernetes optimization platform
Free 60-day TrialPod Metrics
| Metric | Description | Use Case |
|---|---|---|
| Pod Info | General information about a pod. | Used to gather information like the pod-ip, pod-creation date, the network the pod is on. |
| Pod Phase | The pod’s current phase. | Useful to monitor scaling events. |
| Pod Status | Pod’s current status to accept traffic. | Used to diagnose issues with pods becoming unavailable. |
| Pod Status Reason | Pod’s status details. | (see above) |
| Pod Container Waiting | If a pod’s container is not active and is waiting (see next metric for reason). | Useful if an application is unavailable and you need to check if the containers are running or not. |
| Pod Container Waiting Reason | If a pod’s container is in the waiting state, this metric provides the reason for the state. | Useful if a pod is in the waiting state and you need to know if the container has internal issues for scheduling failure. |
| Pod Container Restarts | How many times the container has restarted. | Used to determine the quality of a running container and check if a scheduling failure is due to the container’s internal state. |
This is not an exhaustive list, however, these metrics are the most relevant on a standard Kubernetes cluster. For other use cases such as scheduling pods via the CronJob object, other metrics related to CronJobs would become more useful. A full list of metrics can be found here.
Use Cases for Kube-State-Metrics
Spend less time optimizing Kubernetes Resources. Rely on AI-powered Kubex - an automated Kubernetes optimization platform
Free 60-day TrialThe metrics provided by kube-state-metrics are primarily used to monitor whether or not the expected state of the cluster matches the observed state. They provide an invaluable source of information when things go wrong, especially in scenarios involving high availability applications.
For example, if you are working on a cluster that needs to scale with more requests, and your app monitoring tool tells you that the p95 (or 95 percentile) request response time is spiking, you would use kube-state-metrics metrics to see how many replicas are currently observed on the deployment of your app.
Another example of where kube-state-metrics can also be very useful is while checking node-scaling issues. If a node-pool is scaling up but pods are not being scheduled, then kube-state-metrics data about node taints might point to an issue with the node-pool configuration.
Other common scenarios where kube-state-metrics metrics are useful include:
- Checking if the number of pods in a deployment has reached the desired number of replicas
- If a CertificateRequest has finished issuing a certificate for cert-manager to use for ssl
- If a namespace is undergoing deletion or not
- How much storage has a PersistentVolumeClaim requested
- If a PersistentVolume is bound to a node or not
How to Install Kube-State-Metrics
Prerequisites
Since kube-state-metrics accesses the Kubernetes API through a golang client to read all K8s objects, your kube-state-metrics deployment must have:
- Access to a service account which has a cluster role attached, allowing for read access to all K8s objects (otherwise it will be denied by the API server).
- Access to a service which exposes the endpoint in the cluster.

Manifest Files
The easiest way to set up kube-state-metrics on a cluster is to use the official manifest files. Manifest files are Kubernetes configurations that tell Kubernetes how to set up a collection of resources for an app to be deployed, which in our case is kube-state-metrics.
The official manifest files are available on the kube-state-metrics github repository. The repository contains five manifest files:
- cluster-role-binding.yaml
- This binds the service-account to the cluster role which has read access to the K8s API.
- cluster-role.yaml
- The cluster role which gives read-access to all k8s resources.
- deployment.yaml
- This contains the configuration for the kube-state-metrics pod itself. It is a single replica set deployment with access to the service account (4) bound to the cluster-role (2) using the cluster role binding in (1).
- service-account.yaml
- This is the service account manifest which is bound to (2) using (1)
- service.yaml
- This is the clusterIP service that exposes the /metrics endpoint to the cluster itself.
In order to deploy these set of manifest files to a cluster, you can run the following (assuming kubectl is already configured for your cluster):
kubectl apply -f https://github.com/kubernetes/kube-state-metrics/examples/standard --recursiveThis command will deploy the manifest files onto your cluster. There might be some other steps you might need to make in order to deploy this if you are running this on a cloud-provided k8s cluster. For example, on GKE the strict role permissions mean that the cluster-role and the cluster-role-binding will fail unless your own GCP identity has the cluster-admin role. On GKE, this can be achieved by:
kubectl create clusterrolebinding cluster-admin-binding --clusterrole=cluster-admin --user=$(gcloud info --format='value(config.account)')This command associates the IAM policies of your GCP account to have cluster-admin access to your GKE cluster. Run this command before the manifests are applied. If the console prints Clusterrolebinding "cluster-admin-binding" created after running the create clusterrolebinding command, then you are good to go with the kubectl apply command.
Spend less time optimizing Kubernetes Resources. Rely on AI-powered Kubex - an automated Kubernetes optimization platform
Free 60-day TrialReading Metrics
The metrics exposed can be seen by going to the /metrics endpoint of the kube-state-metrics service via an app running inside the cluster. However, the information displayed is not highly consumable because of the extensive nature of the metrics (it is also a very large output). That is where Prometheus comes in. Prometheus can be configured to scrape the /metrics endpoint and store it in its internal time-series database for analysis.
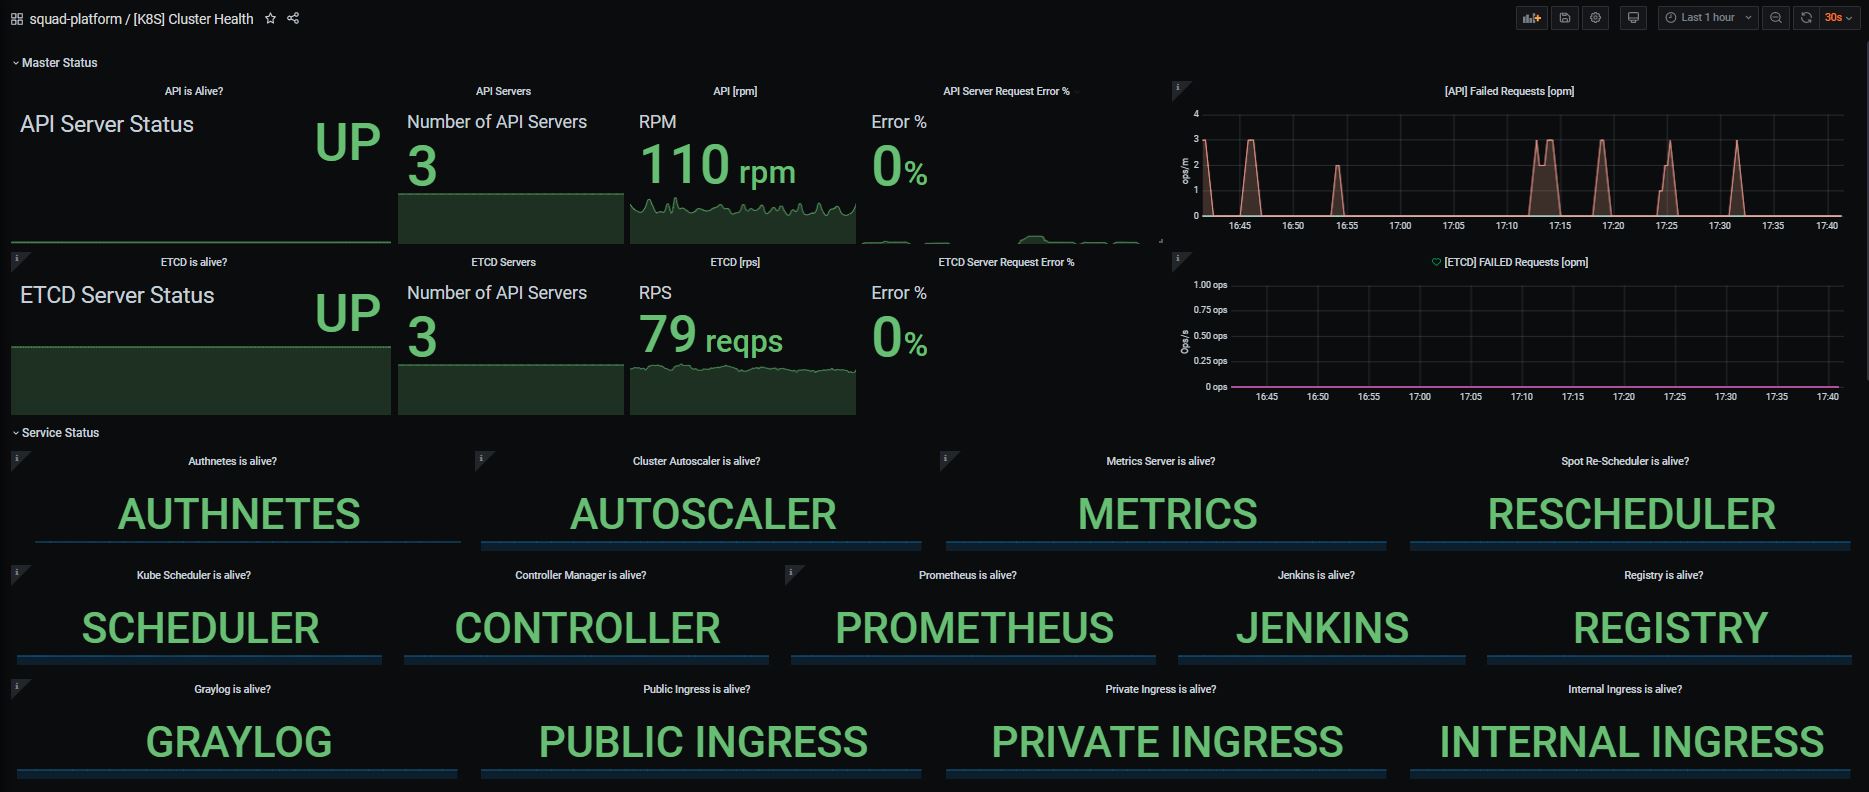
Prometheus by itself is just a query server and a data-store, for visualizations you can install a visualization tool like Grafana. This will allow you to view metrics over time, and monitor the stability and health of the state of the cluster objects.
In order to set up Prometheus to scrape the kube-state-metrics /metrics endpoint, a configuration similar to the following can be adopted, changing the interval as needed:
global:
    scrape_interval:     <# of seconds>s
    evaluation_interval: <# of seconds>s

  scrape_configs:
    - job_name: 'kube-state-metrics'
      static_configs:
        - targets: ['kube-state-metrics.kube-system.svc.cluster.local:8080']
Grafana can then be configured to accept Prometheus as a data source and dashboards can be set up to view the metrics visually.

Best Practices & Common Pitfalls
1. Scaling Kube-State-Metrics
Kube-state-metrics does not use a lot of resources in a cluster, but it does need scaling as the cluster size grows. The cluster size here refers to the number of Kubernetes objects, rather than just the number of nodes.
Usually, 250 MiB memory and 0.1 cores are set for a cluster of 100 nodes, though if you have a cluster with a lot of objects and you feel that the latency for the /metrics endpoint is unacceptably high, then increase the resource allocation of the deployment by modifying the manifest files for the deployment.yaml.
2. Horizontally Scale via Autosharding
Kube-state-metrics includes horizontal scaling built-in via sharding, so if increasing the resource allocation does not decrease the latencies enough, you can consider using the autosharding functionality that is currently an experimental feature. In order to use autosharding, you should deploy the manifest files here instead of the ones previously mentioned.
3. Data Transfers
Kube-state-metrics can also cause a high cost of data transfer if there are a lot of constantly changing Kubernetes objects. For example, if your cluster has a lot of jobs that are running for short periods, then your networking costs from your cloud provider might rise because of the amount of data generated.
In order to mitigate these rising costs, you can configure which metrics you want to be included as part of your reporting practice. This is done via allowlists and denylists that can be passed to kube-state-metrics as part of deployment.yaml. More information can be found here.
4. Create Visualizations From Raw Metric Data
Kube-state-metrics also might show metrics that are different from the ones found on kubectl get commands, which are usually reported via the metrics-server. Since metrics-server applies heuristics to ease readability, the differences in reporting are expected. You should consume the raw kube-state-metrics metrics and evaluate how best to visualize or reduce the data to suit your organization’s reporting requirements.
Final Thoughts
Kube-state-metrics is a valuable tool for anyone managing Kubernetes containers because it gives visibility into all of your object statuses by serving it in a Prometheus-friendly format. Visibility into these statuses becomes exceedingly important as your clusters grow in size or go into production. You can then complete this stack using Grafana to then transform your metric data into easily consumed visualizations for exploration, reporting, and analysis.