Guide to FinOps
Introduction- Introduction: Guide to FinOps
- Chapter 1.1: How to Get Started with AWS Billing Tools
- Chapter 1.2: Best Practices for AWS Organizations
- Chapter 1.3: AWS Tagging: Best Practices for Cost Allocation
- Chapter 1.4: AWS Organizations: All You Need to Know
- Chapter 2.1: Primer: Cloud Resource Management
- Chapter 2.2: Best Practices: Cloud Optimization Savings
- Chapter 2.3: Cloud Computing Cost Savings: Best Practices
- Chapter 2.4: AWS Compute Optimizer
- Chapter 3.1: AWS Cost Management : Top 7 Challenges
- Chapter 3.2: AWS Cost Saving Steps
- Chapter 3.3: AWS Savings Plans
- Chapter 3.4: Spot Instances: A Complete Guide
- Chapter 4.1: The 4 Fundamental Concepts for Enforcing Cloud Cost Management
- Chapter 4.2: Top 10 FinOps Best Practices
- Chapter 4.3: Drilldown: AWS Budgets vs Cost Explorer
- Chapter 4.4: AWS Cost Categories
What is FinOps?
FinOps is the practice of cloud financial management. It requires cross-functional teamwork to identify the optimal trade-off between cost, speed, and agility, which is a balance guided by the strategic and tactical needs of the business.

The History of FinOps
During the first phase of public cloud adoption, most business units made their own buying and engineering decisions independently, as they often do during the early adoption phases of any new technology.
However, as cloud resource costs quickly became a significant portion of IT spending, the procurement process began to draw the attention of corporate executives who requested more transparency in the form of streamlined operations and standardized financial reporting. They understood the strategic value of controlling their expenses intelligently without hamstringing the company’s ability to scale.
We are now in a phase of public cloud adoption where cloud purchasing is being centralized. This effort is typically led by a specialist in finance who negotiates pricing on the company’s behalf with the leading cloud providers and leads the implementation of a corporate cloud governance process.
Who is responsible for FinOps?
With the maturation of cloud adoption, cross-departmental teams have been formed typically incorporating four groups of stakeholders: corporate executives, finance and procurement specialists, engineering and operations managers, and application or product owners. These teams are often led by a cloud procurement specialist. Their primary objective is to promote a culture of responsible spending without hampering innovation or business velocity.

Context for This FinOps Guide
Densify is a proud member of the FinOps foundation which is in turn under the purview of the Linux Foundation. The FinOps foundation leads the industry in advancing this discipline across industries, and as such has defined the core principles of financial cloud management which include a reference framework of best practices, and more importantly a paid training and certification program for practitioners.
Our goal for creating this FinOps collection of articles is to freely provide practitioners with best practices collected from dozens of engagements, as well as technical information, as the first step on their path to seeking formal training and certification from the FinOps foundation.
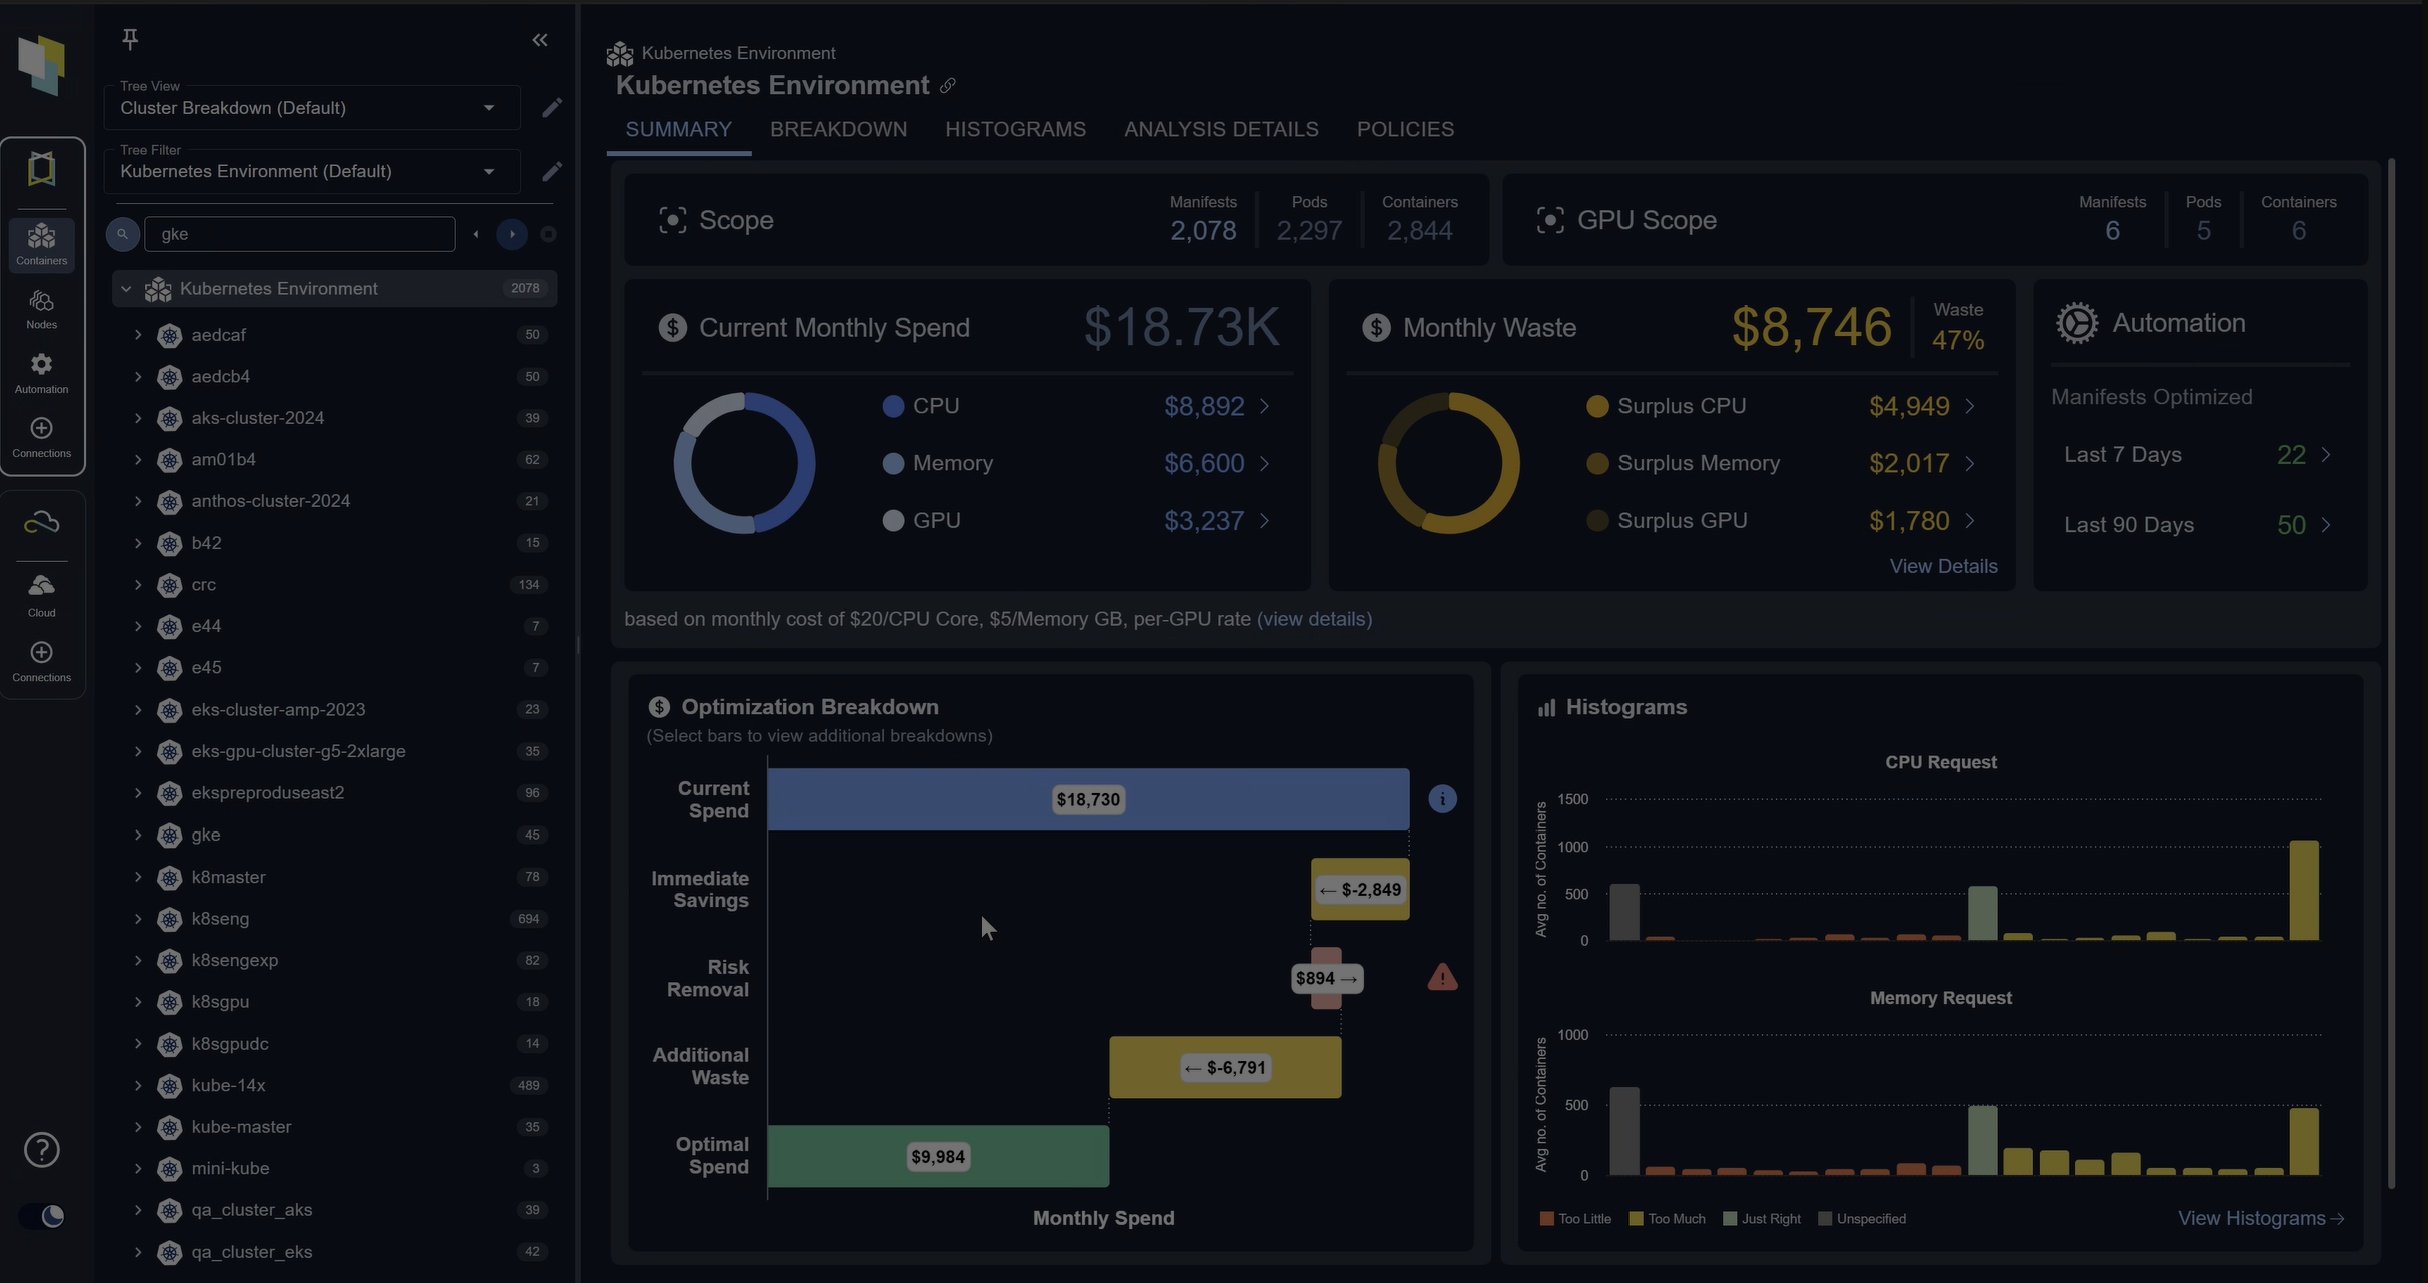
Spend less time optimizing Kubernetes Resources. Rely on AI-powered Kubex - an automated Kubernetes optimization platform
Free 30-day TrialIntroducing the Guide to FinOps
At a high level, our Guide to FinOps simply describes a set of activities required to establish a sense of collective responsibility towards spending on public cloud resources. Of course, you can’t manage what you can’t measure, and you can’t do it alone, so the emphasis of our approach is on measurement, analysis, collaboration, and enforcement. Each stage of our methodology is covered in a dedicated chapter of our FinOps guide.

Spend less time optimizing Kubernetes Resources. Rely on AI-powered Kubex - an automated Kubernetes optimization platform
Free 30-day TrialOur pillars also align with the FinOps Foundation’s “FinOps Journey” phases:
- Inform (empower visibility and allocation)
- Organize (organize and tag resources)
- Optimize (improve utilization)
- Optimize (measure usage and reduce waste) and Save (get discounts and purchase through savings plans)
- Operate (instigate continuous improvement and operations)
- Enforce (budget and chargeback)
The Cloud Platforms
The tools and APIs available from cloud providers are conceptually similar yet unique to each cloud provider. In our guide, we begin with covering technologies and tools specific to Amazon Web Services (AWS), and we will next publish information about Microsoft Azure and Google Cloud. Our product provides support for all cloud platforms, yet we will publish this guide in the order that we are writing the content.
How this FinOps Guide is Organized
We have organized our methodology into a matrix. The columns in the table below represent advancing stages of a governance process. The first table row introduces all of the basic concepts that a reader must become familiar with before being exposed to the best practices shared in the second row. The third row offers a drilldown into specific topics that deserve deeper learning. Our goal is to share the knowledge necessary for a FinOps practitioner to converse with the company’s engineering team, meet with the application owners, negotiate with cloud providers, and lead the implementation of a cross-departmental governance process.
Spend less time optimizing Kubernetes Resources. Rely on AI-powered Kubex - an automated Kubernetes optimization platform
Free 30-day Trial| Organize | Optimize | Save | Enforce | |
|---|---|---|---|---|
| Primer | Learn about the challenges and native tools for organizing | Discover the challenges and tools to isolate cloud waste | Learn about challenges and native tools for purchase planning | Learn to collaborate using budgets and chargeback to enforce efficiency |
| Best Practices | Get recommendations for organizing your cloud resources | Learn best practices for achieving resource optimization and efficiency | Learn best practices for safely optimizing purchasing discounts | Learn collaboration best practices for reporting and early detection of anomalies |
| Drilldown | Delve into AWS Organizations and Tagging | Dig deeper into optimization concepts | Drill into AWS Savings Plans and Spot Instances | Explore AWS Budgets and Cost Allocation Reports |
Spend less time optimizing Kubernetes Resources. Rely on AI-powered Kubex - an automated Kubernetes optimization platform
Free 30-day TrialTry us
Experience automated K8s, GPU & AI workload resource optimization in action.
Try us
Experience automated K8s, GPU & AI workload resource optimization in action.