Kubernetes Optimization: Best Practices & Strategies
Chapter 1Even the most basic Kubernetes deployment is complicated and skill-intensive, and this complexity increases almost exponentially as your deployments grow in size and capacity. Often, Kubernetes and cloud services are presented somewhat simplistically as environments where you just add more capacity and resources as you deploy new applications and grow your user base. Although this is, of course, the case, the hidden truth is that the providers of these cloud services charge you based on your usage, and it is in their interest for you to spend as much money as possible on them. Kubernetes optimization is the key to providing reliable, efficient, and optimal application performance whilst minimizing and controlling operational costs.
Kubernetes optimization can be achieved in several dimensions:
- Performance: getting the work done more quickly either makes or saves money.
- Reliability: getting the work done consistently and without interruptions improves user satisfaction and transaction accuracy.
- Adaptability: being able to adapt to changing user, market, and environmental conditions allows you to capitalize on opportunities and avoid disruption.
Here, we will introduce you to some key strategies for optimizing Kubernetes environments and suggest best practices you can develop to help you and your teams employ them in your own installations.
Understanding Kubernetes Optimization
When we discuss Kubernetes Optimization, we are specifically talking about going beyond the automatic features inherent to Kubernetes and cloud services and identifying aspects of Kubernetes and the associated tool ecosystem that can be monitored, audited, and configured to benefit the operation of the applications we are running. The three overarching and interrelated optimization goals are performance, cost, and reliability, which ultimately encompass all other considerations. Increasing system performance means workloads can be completed more quickly, which could lead to a reduction in the cost per transaction for a web application; improving the reliability of the web application may lead to a similar outcome.
Common challenges to Kubernetes optimization include: not being able to see where performance bottlenecks are actually impacting the application’s latency; hidden relationships between components or configuration decisions that introduce instability; errors introduced by humans into the code and configuration of applications, causing unexpected results; and limits imposed by contractual agreements with service providers that lead to reduced service.
Spend less time optimizing Kubernetes Resources. Rely on AI-powered Kubex - an automated Kubernetes optimization platform
Free 30-day TrialTypes of Kubernetes Optimization
These are the key types of optimization that you can introduce into your environment.
Resource Optimization
As a platform for scheduling and managing the lifecycle of cloud applications, Kubernetes focuses on what it calls compute resources: the CPU cycles an application can consume and the RAM it can allocate at any given time. The special nature afforded to these resources is that the amount of CPU and RAM assigned to scheduled workloads can exceed the total capacity of CPU and RAM in any node. Overallocated resources can result in the kernel in the node unexpectedly terminating containers, resulting in involuntary disruptions to their Pods.
Application designers and Kubernetes operators can tell Kubernetes how much CPU and RAM a workload needs to run by assigning CPU and memory requests; they can also set the maximum resources to be allocated by assigning CPU and memory limits.
Optimizing resource utilization by correctly assigning request and limit values to each workload arguably has the greatest overall impact on your environment, as it improves performance and reliability and reduces costs. Although simple in concept, implementation can be challenging; fortunately, dedicated Kubernetes tools are available.
Performance Optimization
Applications can be affected by several aspects of Kubernetes and cloud services. The observable symptoms are typically the number of transactions they can process and the time it takes to respond. By observing the application and monitoring all aspects of its operation, you can identify possible optimizations.
A common optimization is to place application services that generate the most network traffic on the same node, so that the traffic runs within the kernel rather than across the wires. More complex solutions may include switching network policy enforcement from layer 3 to layer 7, or vice versa, to reduce overhead; increasing the number of replicas for specific containers; moving workloads to GPU nodes; or changing the base node cloud service shape.
Cost Optimization
The key to cost optimization is to pay only for the resources you need to run your workloads at any given time, whilst still providing optimal performance, reliability, and burst capacity for rapid workload demand changes. Clearly, these are conflicting demands, so balancing them in near real time is key to success. You can employ multiple strategies for right-sizing your capacity, including monitoring and observing workloads over time; setting request and limit values to cover all situations; using autoscalers to dynamically adjust workloads according to demand; and dynamically adding and removing nodes from your clusters.
Your service provider may offer Spot Instance pricing, whereby nodes are available at a considerable discount (up to 90%) but may be brought down with very short notice (typically 2 minutes). Your configuration and your designs’ pod disruption budgets must account for losing preempted nodes as involuntary disruptions.
Storage Optimization
Service providers offer various storage options with, sometimes radically varying, costs per unit. Since the application designers ultimately don’t have a say in which physical medium their code uses, you need to optimize your storage usage to match the actual workload demands with the cost options available to you.
The most essential storage optimization strategy is to match PVC (persistent volume claims) to the same-sized PV (persistent volumes), as they have an exclusive one-to-one relationship, thereby wasting any excess capacity in the PV once claimed. Establishing and using dynamic storage provisioning for each storage option you provide to your applications will automatically create matching-sized PV/PVC pairs.
Spend less time optimizing Kubernetes Resources. Rely on AI-powered Kubex - an automated Kubernetes optimization platform
Free 30-day TrialKubernetes Resource Optimization Deep Dive
Setting Resource Requests and Limits
Manual Kubernetes optimization for resource requests and limits typically follows two formulas.
Highest QoS: Setting the request and limits to the exact same amount will cause Kubernetes to automatically assign the highest quality of service to that workload, giving it the best possible chance of being scheduled onto a node and the least likelihood of it being evicted once running, but it is limited to the requested amount of resources, even if the node has excess capacity. This is the one to use for your critical workloads after careful observation to set the optimal request sizes.
Example:
resources:
  requests:
    cpu: "500m"
    memory: "256Mi"
  limits:
    cpu: "500m"
    memory: "256Mi"
2x Rule: Setting the limit to twice the request is a common approach to setting limits for workloads. This will result in a burstable quality of service being assigned to the workload, giving it the best chance of being scheduled onto a node, and capable of using spare node capacity if available, but somewhat susceptible to eviction if the node comes under pressure.
Example:
resources:
  requests:
    cpu: "200m"
    memory: "128Mi"
  limits:
    cpu: "400m"
    memory: "256Mi"
It is good practice to set resource limits for namespaces to ensure capacity for assigned workloads and to balance scalability across the cluster.
Here is an example of setting default requests and hard limits for all the workloads in a development namespace:
apiVersion: v1
kind: Namespace
metadata:
  name: development
---
apiVersion: v1
kind: ResourceQuota
metadata:
  name: dev-quota
  namespace: development
spec:
  hard:
    # Compute resources
    requests.cpu: "4"
    requests.memory: 8Gi
    limits.cpu: "8"
    limits.memory: 16Gi

    # Storage resources
    requests.storage: 100Gi
    persistentvolumeclaims: "10"

    # Object counts
    pods: "20"
    services: "10"
    secrets: "20"
    configmaps: "20"
    replicationcontrollers: "5"
    deployments.apps: "10"
    statefulsets.apps: "5"
Horizontal Pod Autoscaling (HPA)
Out of the box, HPA monitors CPU and memory utilization and tries to balance workloads across nodes by adding and removing replicas to meet a minimum resource target. Sophisticated HPA strategies are possible using custom and external metrics when a metrics adapter, such as the popular Prometheus adapter, is employed.
Custom metrics are collected from Pods and reflect the status of applications running on the cluster. For example, a custom metric could be the number of requests the workload can satisfy each second, which is obviously a key aspect of an application’s performance requirement. By setting a performance objective for the workload to a number of requests it serves per second, HPA will scale the workload across the nodes by adding and removing replicas to meet the goal.
External metrics are those outside the Kubernetes cluster, such as network bandwidth between your services in the cloud and the internet, or the queue length on the message bus. Many system tools provide metrics exports, often in Prometheus format, which can be quickly integrated.
Common considerations for all HPA Kubernetes optimization strategies are:
- Combine the metrics that impact the objectives of your workloads. For example, CPU utilization may affect the number of transactions per second your workload can sustain, so include both metrics to get the best result.
- Normalize custom and external metrics per pod to avoid unstable scaling or thrashing. For example, if you are examining the total number of requests your application is serving, normalize this to the number of requests per second per pod you need to sustain to meet this objective.
- Tune your HPA stabilization windows for adding and removing replicas so that rapid changes in demand don’t lead to thrashing and unnecessary operational overhead in the cluster.
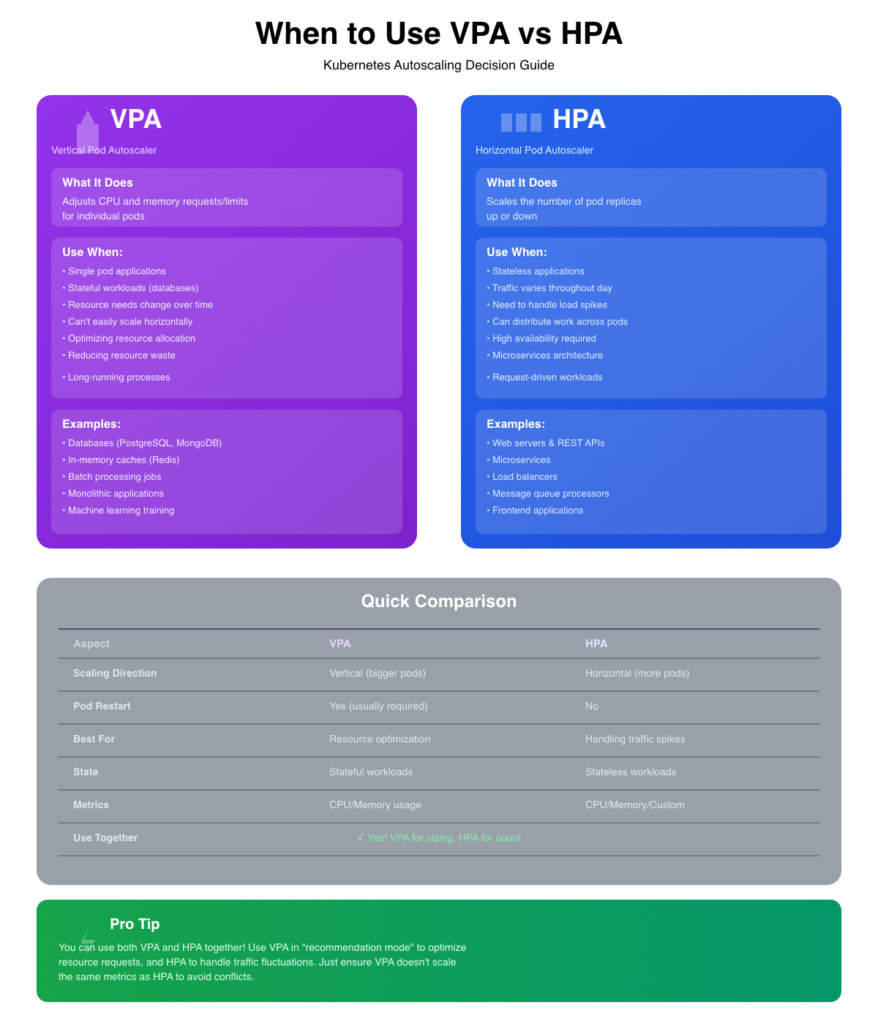
Vertical Pod Autoscaling (VPA)
VPA is best suited for scaling long-running workloads that require significant CPU and memory resources to achieve optimal performance. It is critical to understand that the VPA evicts Pods to change their capacities.
Limitations to VPA:
- Doesn’t verify a resized pod will fit on a node before evicting it. Can result in pods stuck in “pending”
- Uses only 8 days of historical data
- Scaling VPA on the same metric as HPA can cause a runaway scaling event
- Can’t independently size requests and limits, always maintains a fixed ratio
Here we present a chart to compare VPA vs HPA easily and when to combine them.
Cluster Autoscaling
The Kubernetes Cluster Autoscaler differs from the HPA and VPA in that it adds and removes nodes dynamically from your cluster’s node pools, rather than altering Pods. Node pools are groups of identical nodes that share specific characteristics to run workloads with common requirements. The combination of node shapes, the number of node pools, and workload requirements can be combined in several strategies, some of which we list below.
| Goal | Node Pool Strategy |
|---|---|
| Fast scale response | Multiple small pools, tuned cooldown |
| Cost-aware scaling | Spot + on-demand hybrid |
| Fault tolerance | Multi-AZ node pools |
| Workload isolation | Separate pools with taints/labels |
| Efficient bin packing | Size nodes to pod footprint |
| Simplified ops | Use managed node groups or GKE Autopilot |
Performance Optimization Techniques
1. Pod Scheduling Optimization
Efficiently place pods across nodes using node affinity, taints/tolerations, and topology spread constraints to balance workloads, reduce latency, and maximize resource utilization while avoiding hotspots.
2. Network Policy Tuning
Implement fine-grained network policies to control pod-to-pod communication, reducing unnecessary traffic and attack surface while ensuring legitimate connections aren’t blocked, improving both security and network performance.
3. Ingress Controller Optimization
Configure ingress controllers with appropriate buffer sizes, connection limits, keepalive settings, and SSL/TLS optimizations to handle high traffic volumes efficiently and reduce request latency at the cluster entry point.
4. Service Mesh Configuration
Tune service mesh settings like circuit breakers, timeouts, retry policies, and connection pooling to manage inter-service communication reliably while minimizing overhead from sidecar proxies and observability features.
5. Database Connection Pooling
Reuse database connections across requests instead of creating new ones, reducing connection overhead, limiting concurrent connections to prevent database overload, and significantly improving application response times.
6. Caching Strategies
Store frequently accessed data in memory (Redis, Memcached) or CDN edges to reduce database queries and computation, implementing TTLs and cache invalidation patterns to balance freshness with performance gains.
Cost Optimization Strategies
Right-Sizing Workloads
The most fundamental cost-optimization strategy is to ensure your workloads are assigned the resources they need to deliver the required performance, and no more.
Using Spot/Preemptible Instances
By carefully planning your pod disruption budgets, node pools and autoscalers (HPA and Cluster primarily), you can take advantage of spot instances (sometimes known as preemptable instances) offered by your cloud service provider.
Implementing Resource Quotas
Lock down unbound workloads or over-utilization by teams in your clusters by assigning resource quotas to namespaces and assigning all workloads and users to those namespaces.
Optimizing Storage Costs
Implement dynamic storage providers for all the storage options you plan to make available to your users’ workloads. Ensure the most expensive storage option is not the default in any namespace. Consider assigning the most expensive storage options to only the critical services and workloads, using priority classes and namespace management.
Monitoring and Metrics for Optimization
Essential Metrics to Track
Here are the key metrics to track for efficacious Kubernetes optimization:
Resource Utilization Metrics
- CPU usage (requests vs actual usage) – Identifies over/under-provisioned pods
- Memory usage (requests vs actual usage) – Prevents OOM kills and waste
- Disk I/O – Detects storage bottlenecks affecting performance
- Network bandwidth – Monitors pod-to-pod and external traffic throughput
Pod & Container Metrics
- Pod restart count – High restarts indicate instability or resource issues
- Container ready/running status – Tracks availability and health
- Pod pending time – Shows scheduling delays or resource constraints
- OOMKilled events – Signals insufficient memory allocations
Cluster Health Metrics
- Node CPU/memory capacity – Ensures sufficient cluster resources
- Unhealthy nodes – Detects infrastructure problems early
- API server latency – Measures control plane performance
- etcd performance – Critical for cluster stability
Application Performance
- Request latency (P50, P95, P99) – User experience indicator
- Request rate & throughput – Traffic patterns for scaling decisions
- Error rate (4xx, 5xx) – Application health and issues
- Active connections – Load on services
Autoscaling Metrics
- HPA current/desired replicas – Scaling behavior tracking
- VPA recommendations vs actual – Resource sizing accuracy
- Scaling events frequency – Detects thrashing or slow response
Resource Efficiency
- CPU/memory throttling – Shows resource contention
- Request vs limit ratios – Identifies overcommitment risks
- Unused capacity – Cost optimization opportunities
- PV/PVC usage – Storage utilization and growth
Key Ratios to Monitor
- Resource request to actual usage (aim for 70-80% utilization)
- Pod eviction rate (should be near zero)
- Scheduling success rate (should be >95%)
Focus on these metrics using tools such as Prometheus, Grafana, or cloud-native monitoring solutions to maintain optimal cluster performance and cost efficiency.
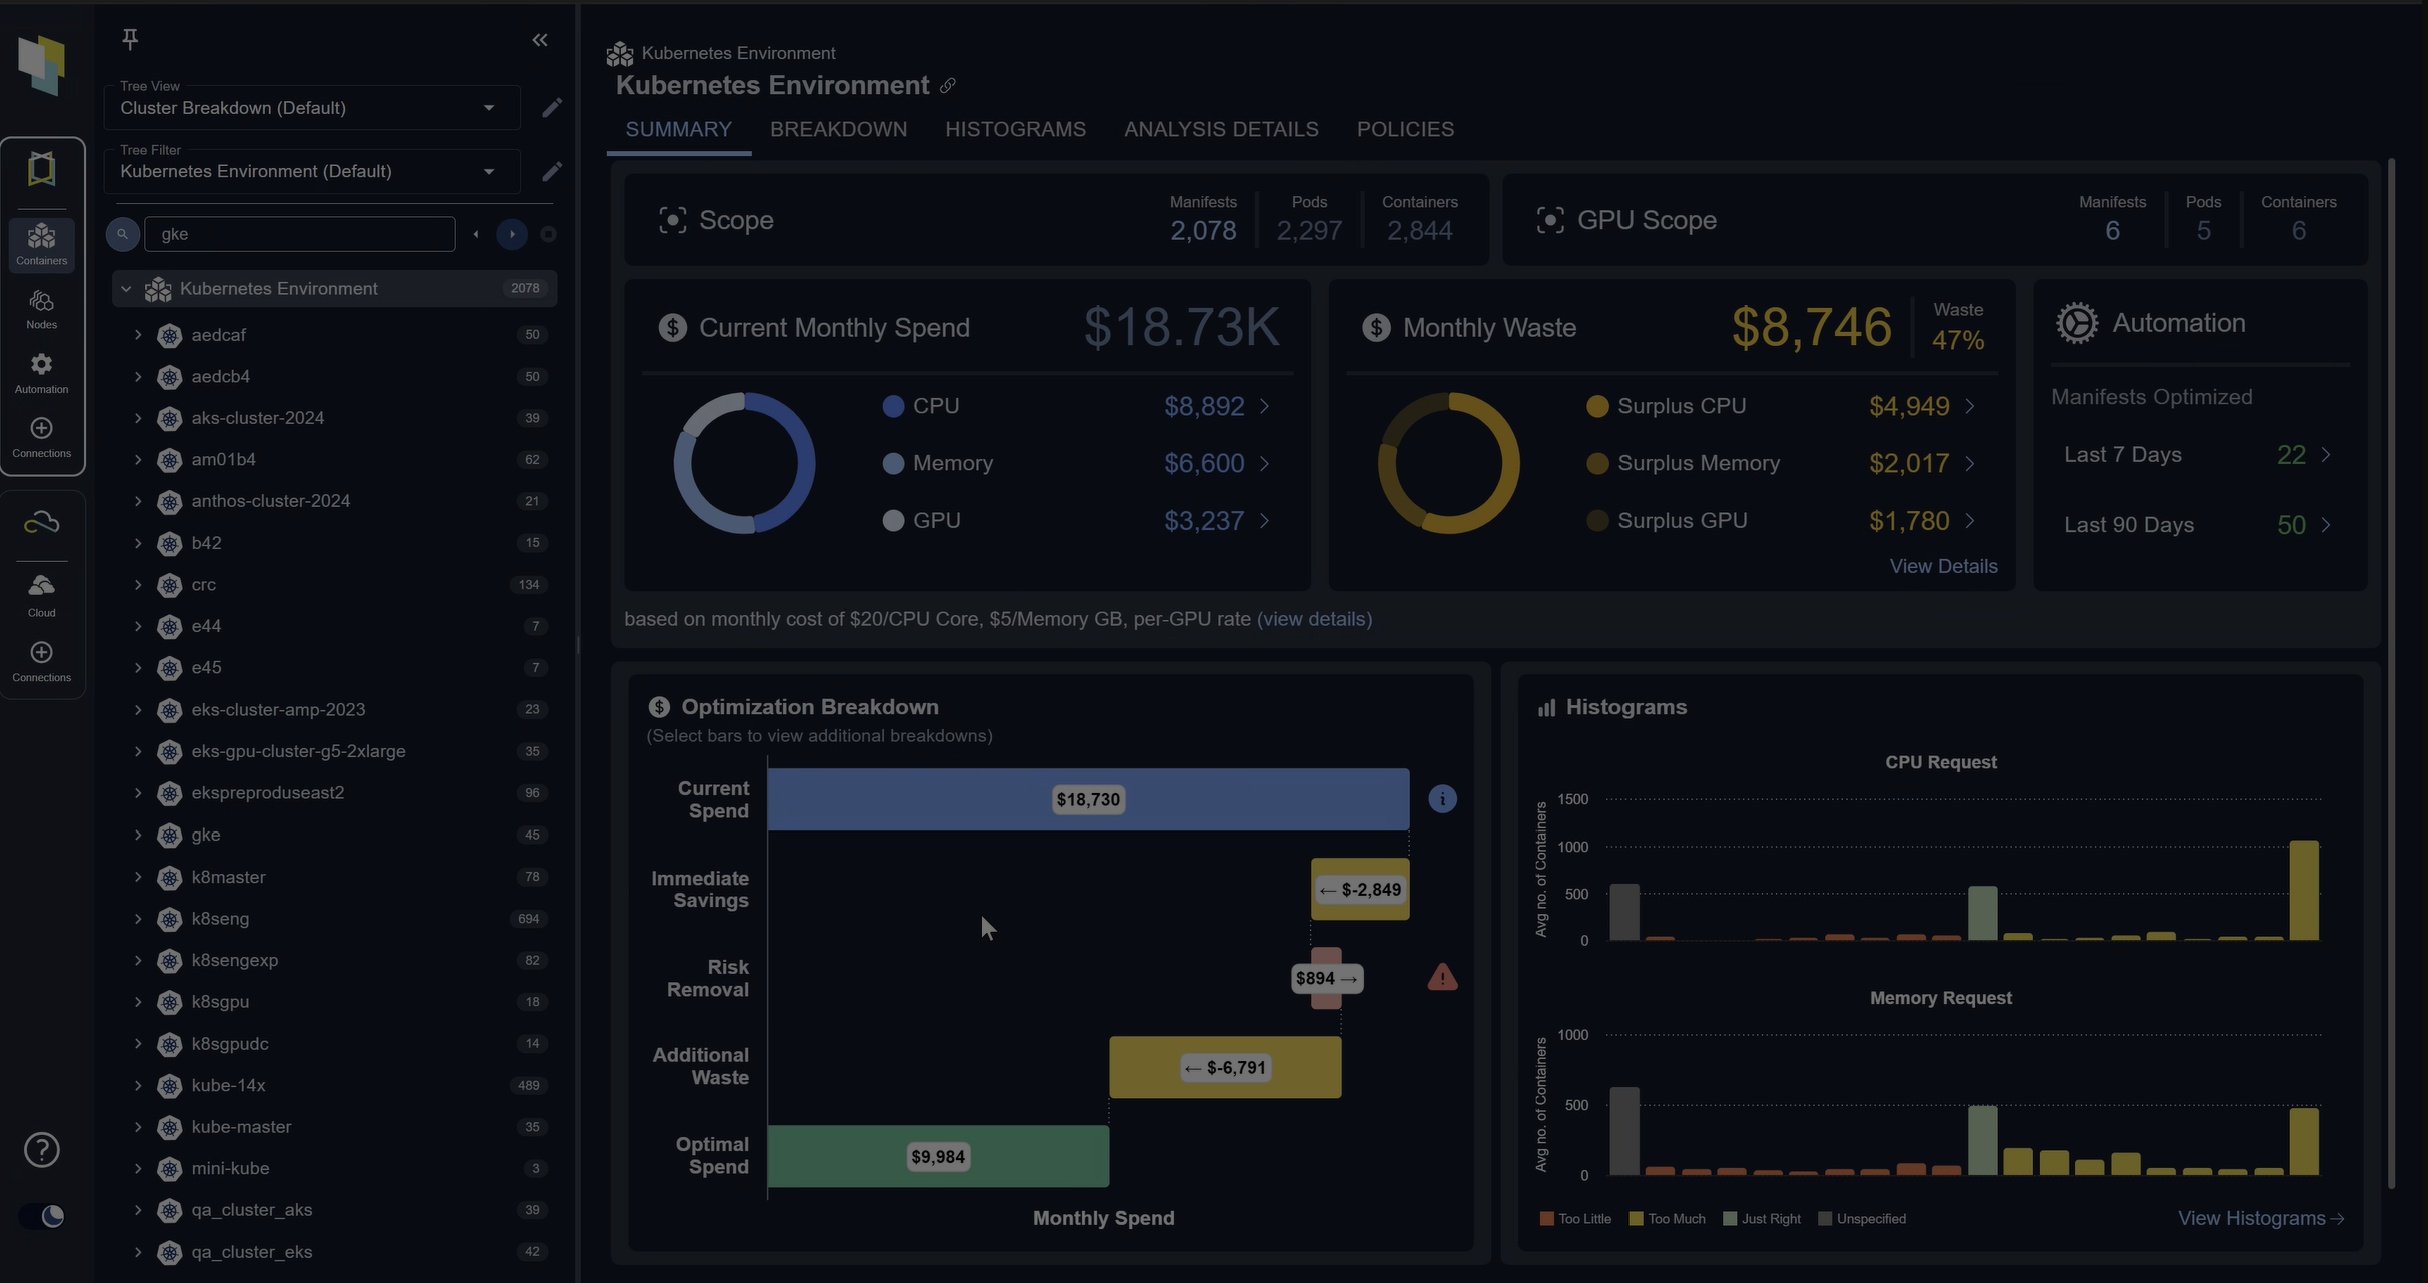
Setting Up Effective Dashboards
Dashboards are real-time views of your environment, so create dials and graphs that display the most essential information to each operator, aligned with their responsibilities. One effective strategy is to have top-level boards that reflect the combined status of several metrics. For example, you could have an application performance board that shows green (>95%), amber (<95%>75%), and red (<50%) depending on the normalized ratios for CPU, memory, requests per second, and response latency of its Pods. Design the dashboards so that key dials can be selected to drill down into the problematic metrics identified instantly.
Spend less time optimizing Kubernetes Resources. Rely on AI-powered Kubex - an automated Kubernetes optimization platform
Free 30-day TrialAlert Configuration
Alerts should be generated only for situations where a timely human action can resolve the issue; if an automated action can resolve the problem, have it take the action and mark it in the logs.
Here are critical Kubernetes alerts you should configure:
Pod & Container Health
- Pod CrashLooping – Pod restarting repeatedly (>3 times in 10 minutes)
- Pod Not Ready – Pod hasn’t reached ready state for >5 minutes
- Container OOMKilled – Container killed due to memory limits
- High Pod Restart Rate – Multiple pods restarting across deployment
- Image Pull Errors – Cannot pull container images from registry
Resource Exhaustion
- Node CPU/Memory Pressure – Node resources >85% for >10 minutes
- Pod CPU/Memory Near Limits – Usage >90% of limits consistently
- Disk Space Critical – Node disk usage >85%
- PVC Almost Full – Persistent volume >90% capacity
- Too Many Pods on Node – Approaching pod limit per node
Cluster Health
- Node Not Ready – Node unavailable for scheduling
- API Server Down – Control plane unreachable
- etcd High Latency – etcd requests >100ms (critical for cluster)
- Control Plane Components Down – kube-scheduler, controller-manager failures
- Certificate Expiration – SSL/TLS certs expiring within 30 days
Application Performance
- High Error Rate – 5xx errors >5% of requests
- High Latency – P95 latency exceeds SLO threshold
- Service Unavailable – No healthy endpoints for service
- Failed Liveness Probes – Liveness checks failing repeatedly
- Failed Readiness Probes – Pods not receiving traffic
Scaling Issues
- HPA at Max Replicas – Cannot scale further despite load
- HPA Unable to Scale – HPA errors or metric unavailability
- Pending Pods – Pods stuck in pending state >5 minutes
- Pod Evictions – Pods being evicted frequently
- Deployment Rollout Stuck – Deployment not progressing
Networking
- High Network Error Rate – Packet loss or connection failures
- Ingress Controller Errors – 5xx errors from ingress
- DNS Resolution Failures – CoreDNS errors or timeouts
- Service Endpoint Changes – Frequent endpoint churn
Storage
- PV Provisioning Failed – Cannot create persistent volumes
- StatefulSet Pod Not Ready – Stateful workload issues
- Slow I/O Performance – Disk latency spikes
Security & Compliance
- Unauthorized API Access Attempts – Failed authentication/authorization
- Privileged Container Running – Security policy violations
- Secret Access Errors – Cannot mount secrets/configmaps
Workload-Specific
- Job Failed – CronJob or batch job failures
- StatefulSet Replica Mismatch – Not all replicas available
- DaemonSet Not Scheduled – DaemonSet missing on nodes
- Deployment Replica Mismatch – Actual vs desired replica count
Alert Configuration Best Practices
- Set appropriate severity levels (critical, warning, info)
- Include runbooks or remediation steps in alerts
- Configure alert grouping to prevent notification storms
- Set grace periods to avoid flapping alerts
- Use multi-window alerting for better accuracy
- Define clear escalation paths for critical alerts
- Test alerts regularly to ensure they fire correctly
Sample Alert Thresholds
- CPU/Memory: Warning at 75%, Critical at 90%
- Error rates: Warning at 1%, Critical at 5%
- Latency: Based on SLO (e.g., P95 >500ms)
- Pod restarts: >3 in 15 minutes
You can implement these alerts using a monitoring solution such as Prometheus Alertmanager.
Tools for Kubernetes Optimization
- Native Kubernetes tools
- Open-source solutions
- Commercial platforms
- Comparison matrix
We have discussed the key native Kubernetes optimization tools: autoscalers (HPA, VPA, CA), resource governors (ResourceQuota, LimitRange), and scheduler optimization (PriorityClasses, metrics), which are either built into the Kubernetes codebase or part of the official ecosystem referenced in the documentation. These should serve as a starting point for understanding and implementing Kubernetes optimization in your deployments, but there are many external tools designed to optimize Kubernetes environments.
The most used open-source tools for optimizing Kubernetes are Prometheus + Grafana and KEDA. We’ve already mentioned using Prometheus to provide metrics to your autoscalers, and it is very often paired with Grafana for observability and monitoring. KEDA is an event-driven autoscaler that extends HPA to scale on external metrics.
Optimization Workflow and Automation
Continuous Optimization Process
Kubernetes is a dynamic, ever-changing environment, as are the cloud applications deployed on it. You will need to implement a continuous optimization process in your team, deployment, or both. Ideally, automation will help you analyze your workloads on a rolling basis, not just when they are first deployed. Implement a feedback process within your teams and deployments so that optimization results can be fed back into the running state to enable further improvements. Employing dedicated Kubernetes optimization tools that automatically adjust running environments may be the optimal solution.
GitOps for Configuration Management
Developers are best suited to determine the resource needs for their code. They can write the requests and size limits into the configuration files for their containers. Kubernetes operators and administrators will create configuration objects for Pods, namespaces, policies, storage, and more. Optimization practices will change these objects. Even if you are not operating a DevOps environment for your application teams, we recommend you set up a GitOps workflow for all your Kubernetes configuration files. This will allow you to capture and record all the changes made manually and by your automation tools, and it is instrumental when creating a continuous optimization process with a feedback loop.
Policy-as-Code Implementation
Rather than relying on humans to manually encode your policies into Kubernetes and application configuration files, you can establish a centralized policy engine that automatically does this for you. Typically, this is integrated into your GitOps pipeline, giving you holistic control over your Kubernetes deployments.
Common Optimization Mistakes to Avoid
1. Over-provisioning resources
The most significant operational cost in cloud application deployments is resource usage charges. Paying for resources you don’t need is expensive and wasteful, so it is critical to be able to deploy and pay only for the resources your workloads require to perform optimally and reliably at any moment. Remember that workload demands change with external factors (such as seasonal events, sales promotions, quarterly reports, etc.), and your Kubernetes optimization strategy should account for them.
2. Ignoring namespace isolation
Ensure teams, projects, and applications can have their requirements met individually according to their needs. Set appropriate defaults and policies for each namespace. This will stop the actions of one team or application from affecting the performance and stability of other teams or applications across the cluster.
3. Neglecting monitoring
Effective Kubernetes optimization is impossible without knowing how each element affects the others over time. Application performance and reliability can be impacted by elements outside your Kubernetes deployment that you can still account for if you know about them. You need to implement appropriate monitoring across your entire cloud service environment to ensure you are not affected by unexpected influences and able to respond to them as they change.
4. Improper autoscaling configuration
Autoscalers are key to Kubernetes optimization, but fraught with danger when misunderstood. Selecting the appropriate metrics to feed into each is essential, and remember that they will schedule the number of replicas based on the metric that generates the highest demand. Combining autoscalers provides the most sophisticated workload optimization, but it is critical to heed their operating instructions, as developers have already documented how they can interact in a counterproductive or disastrous manner.
5. Lack of resource quotas
Without resource quotas, workloads in one namespace can consume resources intended for another, thus impacting performance and reliability.
Real-World Optimization Case Studies
- Enterprise optimization success story
- Startup cost reduction example
- Performance improvement case
Conclusion
Kubernetes is an excellent platform for running cloud applications: developers can write applications that automatically scale to process workloads; operators can allocate resources to those workloads dynamically; autoscalers can distribute workloads across resources based on demand. Kubernetes optimization is a method for minimizing the costs of running those applications while providing optimal performance and reliability. Kubernetes has mechanisms to optimize, but it doesn’t have built-in mechanisms to identify costs or demand patterns. Implementing monitoring, performing regular audits, and analyzing application demand over time generates workload patterns that predict the resource requirements for those applications. If you can accurately anticipate resource demand, you may be able to take advantage of spot instance pricing.
Like many other aspects of the Kubernetes ecosystem, people and companies have created dedicated Kubernetes optimization tools that can inform or even automate workload optimization in running environments. Kubex by Densify can identify the optimal resource requirements for each workload and even use AI and machine learning to predict changes over time. Kubex can even integrate natively with Kubernetes to automatically set the resources requested by Pods to their optimal values.
Spend less time optimizing Kubernetes Resources. Rely on AI-powered Kubex - an automated Kubernetes optimization platform
Free 30-day TrialTry us
Experience automated K8s, GPU & AI workload resource optimization in action.
Try us
Experience automated K8s, GPU & AI workload resource optimization in action.