Kubernetes Resource Management: Complete Guide 2025
Chapter 3New practitioners of Kubernetes may assume that Kubernetes resource management is inherent and automatic in deployed clusters. While the developers of Kubernetes attempted to provide as comprehensive a solution as they foresaw would be required, modern and rapid technological developments and methodologies can offer significant benefits to running clusters. Luckily, the developers also foresaw that new things would inevitably emerge. So they built extensibility into Kubernetes as a fundamental capability, along with a standard set of APIs to facilitate it. Out of the box, new Kubernetes clusters will attempt to ensure that the basic requirements for any application are delivered to the level that the application authors designed, with the built-in ability to provide scaling and availability features to those applications.
The built-in resource controls include CPU and RAM allocations, networking load balancing, and mechanisms for maintaining service levels under specific constraints, such as hardware failure. These controls are primarily focused on maintaining desired minimum service levels for starting applications within a cluster, and if abused or misconfigured, can result in expensive and even unstable environments. A common challenge faced by operators is that, even though they appear to have enough nodes to run a given set of applications, they fail to start or run correctly, or running applications suddenly begin to experience issues. The standard solution is often to add additional nodes to the cluster or increase the RAM on existing nodes.
The art of Kubernetes Resource Management aims to utilize the controls built into Kubernetes for CPU, RAM, networking, and storage to provide smooth application operation according to their individual design goals and objectives without massively over-provisioning expensive hardware resources.
Fundamentals of Kubernetes Resource Management
Understanding Kubernetes Resources
Applications running on Kubernetes are deployed as Pods. Each Pod is instantiated as a special object on the operating system on which it is being deployed: cgroups on Linux and namespace-filtered job objects on Windows. By default, Pods are unconstrained and will utilize as many CPUs and CPU time, as well as as much RAM as required to execute all the containers within the Pod. Kubernetes allows the setting of constraints on the amount of CPU time and system memory a Pod can consume to manage the resources it utilizes.
Kubernetes presents all storage to containers in a Pod via storage volumes, and each volume can either be persistent or ephemeral. The contents of persistent storage, as its name implies, are maintained even if the container to which it is connected is terminated; this may also be thought of as stateful. The contents of ephemeral storage evaporate at the termination of the container to which it is attached; this may also be thought of as stateless. By default, storage used by containers is ephemeral. Essentially, if you want to keep the changes recorded to storage by the container, you must employ persistent storage volumes
Resource Units and Measurements
Kubernetes resource management measures the utilization of CPU and memory (RAM) in standardized units. A CPU unit of 1 is the equivalent of a single physical or virtual core. It is possible to request less than a single CPU, down to a minimum of 0.001 CPUs. A single CPU can also be measured as 1000m, which can be read as “one thousand millicpu” (sometimes known as “one thousand millcores”). This standardized representation means that 500m CPU represents roughly the same amount of computing power when running on a single-core, dual-core, or 64-core machine.
Kubernetes memory is measured in bytes. The amount of memory can be expressed in various ways: as a plain integer, a fixed-point number, a decimal suffix (k, M, G, etc.), or a power-of-two suffix (Ki, Mi, Gi, etc.). As RAM is most usually physically aligned and utilized by CPUs in power-of-two boundaries, the MiB nomenclature may be the best standard to adopt.
How Kubernetes Schedules Resources
The built-in scheduler for Kubernetes Resource Management is kube-scheduler, which selects a node in the cluster on which to start unscheduled Pods. It employs a two-phase selection process to choose the target node, consisting of filtering and scoring. Filtering scans the nodes in the cluster to determine which are capable of running the Pod (known as feasible nodes), taking into account its specific needs and excluding nodes that do not have sufficient resources to run the Pod. Specific metrics are then examined for each feasible node and weighed to determine a score. Ultimately, the node with the highest score is selected to run the Pod.
Typical metrics evaluated include the available CPU and RAM, whether the image is already cached on the node, affinity and anti-affinity rules for the Pod, and current status conditions flagged on the node.
One key consideration in this process is the number of nodes to be evaluated in the filtering phase. Small clusters always evaluate all the nodes in the cluster. As clusters get larger, a smaller percentage of all the nodes will be assessed during a single scheduling request. This is to balance the selection of the ideal target node for any given Pod against the time taken for the evaluation process before the Pod starts running. If all nodes are identical and all Pods have no special needs, then this latency can be reduced to an absolute minimum by making the number of nodes to be evaluated very small. Contrarily, if each Pod is expected to be long-lived, then evaluating all the nodes to pick the ideal target is the best strategy.
Spend less time optimizing Kubernetes Resources. Rely on AI-powered Kubex - an automated Kubernetes optimization platform
Free 30-day TrialCore Resource Management Concepts
When you specify a Pod, you can choose to tell Kubernetes how much of each resource a container needs. The most common resources are CPU and RAM, but there are others.
Resource Requests
A resource request tells Kubernetes how much of each resource your container needs to operate. The Scheduler uses this request to select feasible nodes on which that Pod can run. When starting the Pod on its target node, Kubernetes reserves at least the requested amount of that resource specifically for that container to use. If there are no feasible nodes, then that Pod will not be scheduled. A container can use more than the requested amount of resource once it is running on a node with sufficient resources available. In other words, you may specify a request of 256MiB of memory for a container, which, if scheduled to run on a node with 8GiB of RAM, may try to use more than 256MiB when running.
Resource requests are often referred to as guaranteed capacity. Any resources you request for your container or pod will be set aside specifically for that workload and be deducted from the “available” resources on that node. Once all the available resources on a node are exhausted, no more pods will be scheduled on that node, even if you’re not using all the resources you’ve requested. This makes it important to only request the resources your workload will actually use. Otherwise you may end up with many nodes, all going underutilized.
Note that compute resources are the only resources that can be overallocated at the moment, i.e., containers can only exceed their requested cpu and memory resources while running, up to their limits, where set.
Another critical note is that if you assign a resource request larger than any node can provide, the Pod will be accepted by Kubernetes, but its deployment status will remain Pending until a node with sufficient resources is added to the cluster.
Resource Limits
A resource limit tells Kubernetes how much of each resource a container can use on a running node, and Kubernetes enforces these limits while the container is running. Ultimately, CPU and memory limits are enforced by the kernel.
When a container approaches its cpu limit, the kernel will deschedule it until the next time slice is available, and thus this limit is a hard limit enforced by the kernel. Containers may not use more CPU than is specified in their cpu limit.
On Linux, memory limits are enforced by the kernel using the Out Of Memory Killer (OOM), whereby a container using more RAM than its memory limit will be terminated by the kernel. Windows does not have an OOM Killer, but it will start paging to disk under memory pressure, which will cause severe and unexpected performance degradation across the node.
An important consideration when limiting memory is the use of ephemeral storage backed by RAM, such as emptyDir volumes, as these will count towards the container’s memory budget. If you don’t specify a limit to the size of such volumes, you may easily exceed the container’s memory limit, exposing it to OOM termination or performance degradation
Quality of Service (QoS) Classes
Kubernetes Quality of Service (QoS) classes are categories that Kubernetes uses to determine how Pods receive CPU and memory resources when a node is under pressure. They’re determined automatically based on how you assign resource requests and limits to the containers in a Pod.
1. Guaranteed
Determined when every container in the Pod has CPU and memory requests assigned, and requests are equal to limits.
Example:
resources:
requests:
cpu: "500m"
memory: "256Mi"
limits:
cpu: "500m"
memory: "256Mi"
Results:
- Gets the highest priority when the node runs out of resources.
- Only evicted if it exceeds its memory limit (and a container is OOM Killed).
- CPU throttling may happen, but never below the assigned request.
2. Burstable
Determined when at least one container in the Pod has a request or limit specified.
Example:
resources:
requests:
cpu: "200m"
memory: "128Mi"
limits:
cpu: "500m"
memory: "512Mi"
Results:
- Guarantee the resources in the requests.
- Can “burst” up to the limit if the node has free capacity.
- More likely than Guaranteed to be evicted during memory pressure.
3. BestEffort
Determined when no requests or limits are assigned for any container in the Pod.
Example:
resources: {}
Results:
- Gets whatever is left on the node.
- First to be evicted if the node runs out of memory.
- No CPU guarantee, and may get throttled heavily.
The three Kubernetes QoS classes are compared in the table below.
| QoS Class | Requests & Limits Requirement | Resource Guarantee | Eviction Priority (when node under pressure) | Typical Use Case |
|---|---|---|---|---|
| Guaranteed | Every container in the Pod must have CPU + memory requests = limits | Pod gets exactly what it requests; not throttled below request; memory capped at limit | Last to be evicted | Critical workloads that must not be disrupted (e.g. databases, core services) |
| Burstable️ | At least one container has requests set (not all equal to limits), or some have limits but higher than requests | Guaranteed minimum equal to requests; can “burst” up to limits if spare capacity exists | Evicted after BestEffort, before Guaranteed | General workloads with variable usage (e.g. web servers, batch jobs) |
| BestEffort | No requests or limits set for any container in the Pod | No guaranteed resources; only gets leftovers on the node | First to be evicted | Non-critical, low-priority jobs (e.g. background processing, experimental workloads) |
Spend less time optimizing Kubernetes Resources. Rely on AI-powered Kubex - an automated Kubernetes optimization platform
Free 30-day TrialImplementing Resource Requests and Limits
Setting Appropriate Requests
It may seem a good idea to let Kubernetes and the kernel manage your workloads according to their best design, after all, they are both designed to manage multiple workloads across shared resources, and have been developed carefully and industry tested over many years. For many situations this may indeed be the best policy but for workloads that are critical, time bound, intolerant of latency, or complex, assigning the minimum amounts of resources required to achieve their operational goals is essential.
One reason DevOps and other methodologies combine developers with operators is so that the writers of the code can directly inform the operators’ configuration choices. Developers should have a good understanding of the resources required to run their programs, especially when thinking about memory and storage as these resources will be specifically requested in their code. They should be providing the resource limits to be assigned. This is even more important when employing ‘something-as-code’ automation mechanisms, where the configuration settings will be written by the developers themselves as part of the code package.
A common response to not knowing the requirements of a workload to be deployed is simply to over-allocate resources in the hope that the code will always have what it needs when running. The result of this approach results in the need to provision more resources than will ever be required, leading to increased cost and inefficiency across the environment.
Running workloads can be monitored and analysed to see what resources they are actually consuming in order to accurately set the resource requests (and limits).
Configuring Resource Limits
Assigning resource limits serves a few purposes:
- ensures that a container can’t overconsume resources by going rogue
- mitigate the consequences of memory leaks or spin-locks impacting the overall environment
- ensuress that the workloads are scheduled to the optimal nodes
- reduces the likelihood of being evicted or killed unexpectedly
Request/Limit Ratios
The safest method to avoid unexpected terminations to your workloads is to configure resource limits equal to their request sizes. Unintended consequences of this approach can lead to poor performance of the workloads even when plenty of resources are available on the nodes they are running on. Careful analysis and monitoring of workloads without limits can help you to find their ‘sweet spot’ before assigning requests and limits into their configuration files. Note that because a pod with Guaranteed QoS should have requests and limits set to the highest amount of capacity your workload might burst to, this often results in higher node costs as some capacity remains idle outside of peak hours. However for critical production workloads, the reduced risk may justify the additional costs.
Setting cpu limits above cpu requests will let your container use more CPU if available on the node without risk of termination (as the CPU will just get throttled if resources decline). This is known as bursting.
Setting memory limits above memory requests allows you to burst to higher capacity, but could subject your container to OOM kills if the node the pod is running on becomes memory constrained.
Container vs Pod Resources
The specification for a container may contain resource requests and limits, and these are enforced at the container level. Pay attention to the fact that all containers in a Pod are evaluated for scheduling and resource control on the running nodes; if one of them is configured differently from the others, it will affect the whole Pod. This is especially important when considering the QoS class to which the Pod will be assigned. The sum of all requests and limits for all containers in a Pod can be thought of as the request and limit of that resource for the Pod, which is what the scheduler evaluates.
Kubernetes 1.34 allows you to specify Pod level resource budgets and limits specifically for cpu, memory, and hugepages that are shared by all the containers in that Pod. This has the key benefit of enabling containers within a Pod to share idle resources with one another, thereby improving resource utilization.
Resource Quotas and Limit Ranges
Namespace Resource Quotas
Namespace resource quotas are the key to Kubernetes resource management across teams, functions, departments, and priorities. They enable the managed sharing of a Kubernetes cluster, ensuring each user receives the appropriate share of the finite resources to achieve their assigned purpose without consuming more than they need. Administrators implement them through the ResourceQuotas mechanism, which is often enabled by default on a Kubernetes environment by setting the ResourceQuota flag in the –enable-admission-plugins= API server control. Resource quotas are enforced in any namespace where there is a ResourceQuota in that namespace.
Resource quotas can be applied to many resource types, but overcommit is only supported for compute resources; all other types of resources are limited to the specified amount.
To effectively implement namespace resource quotas in your Kubernetes environment, consider your specific requirements, environmental limits (resources available), and take measured steps towards the final configuration.
Planning Phase
1. Assess Current Resource Usage
Before implementing quotas, analyze the existing resource consumption of your running, unbound workloads to determine which resources are being used and where.
# Check current resource usage across namespaces
kubectl top nodes
kubectl top pods --all-namespaces

# Get detailed resource requests and limits
kubectl describe nodes
2. Define Resource Categories
Identify which resources need quotas based on your cluster’s constraints.
Compute resources are the most important to set correctly in a shared environment for two key reasons: (1) they can be overallocated by the nodes they are running on, i.e., using more resources than assigned, (2) containers are scheduled based on the request sizes and, thus, may end up strained for resources on their node when competing with the other containers on that node. As of Kubernetes 1.34, only cpu and memory resources can be overallocated.
Setting requests for non-compute resources effectively allocates those resources permanently to those containers while they are running, thus preventing any workload wanting them from being scheduled once they have run out.
Examples of resources that can be limited are:
Compute Resources: – CPU requests and limits – Memory requests and limits – Ephemeral storage
Object Count Limits: – Pods, Services, ConfigMaps – Secrets, PersistentVolumeClaims – Ingress objects
Storage Resources: – Persistent volume claims – Storage class-specific quotas
3. Establish Quota Strategy
For each of your departments, teams, or environments that you have identified as needing to share your cluster, define a quota allocation strategy that suits them.
An example quota allocation strategy might be:
- Development environments: Lower quotas, more namespaces
- Staging environments: Medium quotas, moderate isolation
- Production environments: Higher quotas, strict governance
Implementation Steps
Step 1: Create Namespaces with Resource Quotas
For each of your identified environments that share your cluster, create namespaces that provide the resources you have determined to be appropriate.
Here are example ResourceQuota definitions for a development namespace and production namespace environment:
apiVersion: v1
kind: Namespace
metadata:
  name: development
---
apiVersion: v1
kind: ResourceQuota
metadata:
  name: dev-quota
  namespace: development
spec:
  hard:
    # Compute resources
    requests.cpu: "4"
    requests.memory: 8Gi
    limits.cpu: "8"
    limits.memory: 16Gi

    # Storage resources
    requests.storage: 100Gi
    persistentvolumeclaims: "10"

    # Object counts
    pods: "20"
    services: "10"
    secrets: "20"
    configmaps: "20"
    replicationcontrollers: "5"
    deployments.apps: "10"
    statefulsets.apps: "5"
apiVersion: v1
kind: ResourceQuota
metadata:
  name: production-quota
  namespace: production
spec:
  hard:
    # Higher limits for production
    requests.cpu: "20"
    requests.memory: 64Gi
    limits.cpu: "40"
    limits.memory: 128Gi

    # Storage quotas
    requests.storage: 1Ti
    persistentvolumeclaims: "50"

    # Object limits
    pods: "100"
    services: "50"
    secrets: "100"
    configmaps: "50"

    # Extended resources
    count/ingresses.extensions: "20"
    count/jobs.batch: "10"
Step 2: Apply Storage Class Specific Quotas
Your cluster may offer storage options; in this case, you should apply quotas for these to each of your namespaces.
Here is an example of a storage quota for a production environment with SSD and HDD storage facilities:
apiVersion: v1
kind: ResourceQuota
metadata:
  name: storage-quota
  namespace: production
spec:
  hard:
    # Storage class specific quotas
    ssd.storageclass.storage.k8s.io/requests.storage: 500Gi
    ssd.storageclass.storage.k8s.io/persistentvolumeclaims: "20"
    hdd.storageclass.storage.k8s.io/requests.storage: 2Ti
    hdd.storageclass.storage.k8s.io/persistentvolumeclaims: "100"
Step 3: Implement Priority Class Quotas
Ensure that critical workloads can be scheduled even when resource contention is present in the cluster.
This example allows for 5 high-priority Pods to be scheduled in the production namespace and ensures they have sufficient resources to perform their tasks.
apiVersion: v1
kind: ResourceQuota
metadata:
  name: priority-quota
  namespace: production
spec:
  hard:
    # Limit high-priority pods
    count/pods.high-priority: "5"
    requests.cpu.high-priority: "10"
    requests.memory.high-priority: 32Gi
  scopeSelector:
    matchExpressions:
    - operator: In
      scopeName: PriorityClass
      values: ["high-priority"]
Spend less time optimizing Kubernetes Resources. Rely on AI-powered Kubex - an automated Kubernetes optimization platform
Free 30-day TrialDeployment and Management
Apply your assigned resource quotas to your cluster. This can be achieved using kubectl as in the example below:
# Apply resource quota
kubectl apply -f resource-quota.yaml

# Verify quota creation
kubectl get resourcequota -n development
kubectl describe resourcequota dev-quota -n development
Monitor the quota utilization in your cluster. This can be done using kubectl as in the example below:
# Check current quota usage
kubectl get resourcequota -n development -o yaml

# Monitor quota status
kubectl describe resourcequota dev-quota -n development

# Get detailed usage information
kubectl top pods -n development
You can adapt your running namespaces to change their quotas while they are running. Here is an example of doing this with kubectl:
# Edit existing quota
kubectl edit resourcequota dev-quota -n development

# Or apply updated YAML
kubectl apply -f updated-quota.yaml
LimitRanges Configuration
You can assign default request and limit sizes for cpu and memory to a namespace so that any containers created in that namespace automatically inherit those request and limit sizes without them being assigned explicitly in the container configuration. This can be used to ensure that unconstrained containers cannot unexpectedly consume too much resource on the node once they are scheduled, as well as somewhat protect them from OOM Kills.
LimitRanges are especially useful for clusters that employ namespace resource quotas for cpu and memory, as they ensure that users don’t have to remember to assign explicit request and limit values for the containers they wish to create.
Here is an example of how to configure the request and limit range for memory for a namespace.
apiVersion: v1
kind: LimitRange
metadata:
  name: dev-limits
  namespace: development
spec:
  limits:
  - default:
      cpu: 500m
      memory: 1Gi
    defaultRequest:
      cpu: 100m
      memory: 256Mi
    max:
      cpu: "2"
      memory: 4Gi
    min:
      cpu: 50m
      memory: 128Mi
    type: Container
  - max:
      cpu: "4"
      memory: 8Gi
    type: Pod
Any unconstrained container created in the namespace to which this example is applied will automatically be assigned a resource request of 256Mi and a resource limit of 512Mi.
Setting default resource ranges for a namespace does not prevent containers with explicit resource requests and limits from being allocated those specified amounts. For example, if a container is configured with a 1 GiB request, it will receive 1 GiB when scheduled on an appropriate node. This also applies when minimums are specifically not requested, i.e., if a container is assigned a limit of 1 GiB but no request size, that container will be assigned 1 GiB as both its minimum and maximum running memory.
Note that it is possible to configure a container to request more memory than the limit value assigned to the namespace; in this case, the Pod containing that container will not be scheduled.
LimitRanges can be set for more than just compute resources, such as PersistentVolumeClaim, but the objects must be a valid DNS subdomain name.
Priority Classes
Priority classes in Kubernetes are cluster-wide resources that inform the scheduler how to treat a Pod marked as such compared to others. You can define your own PriorityClass objects to apply to your cluster and assign a relative priority as a simple integer value; the higher the value, the higher the priority. You can also assign a preemptionPolicy flag to indicate whether lower-priority Pods should be evicted from running nodes to free up the required resources for scheduling the higher-priority Pod: the default is set to true. The scheduler always attempts to schedule higher-priority Pods when resources are under contention.
Use PriorityClasses to ensure your mission-critical workloads take precedence over lower-priority workloads during scheduling and when evicting pods under node pressure. If you set too many workloads to high priority, you will defeat the purpose of PriorityClasses, as Kubernetes will be unable to make informed decisions about which workloads to prioritize. When assigning high-priority workloads, pay attention to Pod disruption budgets to ensure minimum operational levels of service.
Here is an example of configuration files to define a critical database service that will almost always get scheduled, even at the expense of all other Pods in the cluster, but is restricted from consuming more resources than will ever be required to operate at the designed level.
This gives the critical database Pod a very high scheduling priority:
apiVersion: scheduling.k8s.io/v1
kind: PriorityClass
metadata:
  name: critical-db-priority
value: 1000000        # very high; higher than any normal app
globalDefault: false  # don’t apply to all Pods automatically
description: "Priority for critical database workloads."
This ensures operators can’t run too many high-priority database Pods in the namespace :
apiVersion: v1
kind: ResourceQuota
metadata:
  name: critical-db-quota
  namespace: production
spec:
  hard:
    pods: "10"
    requests.cpu: "4"
    requests.memory: "8Gi"
    limits.cpu: "8"
    limits.memory: "16Gi"
  scopeSelector:
    matchExpressions:
      - scopeName: PriorityClass
        operator: In
        values: ["critical-db-priority"]
This ensures voluntary disruptions (e.g., node drains, rolling updates) don’t take all replicas of your database offline:
apiVersion: policy/v1
kind: PodDisruptionBudget
metadata:
  name: critical-db-pdb
  namespace: production
spec:
  minAvailable: 1
  selector:
    matchLabels:
      app: postgres
Attach the priority class, and optionally pin it to dedicated nodes:
apiVersion: apps/v1
kind: Deployment
metadata:
  name: postgres-db
  namespace: production
spec:
  replicas: 2
  selector:
    matchLabels:
      app: postgres
  template:
    metadata:
      labels:
        app: postgres
    spec:
      priorityClassName: critical-db-priority
      tolerations:
        - key: "critical-only"
          operator: "Exists"
          effect: "NoSchedule"
      containers:
      - name: postgres
        image: postgres:15
        resources:
          requests:
            cpu: "500m"
            memory: "1Gi"
          limits:
            cpu: "1"
            memory: "2Gi"
Advanced Resource Management Strategies
As demands on services within your cluster ebb and flow over time, you may need to add or remove capacity in those services by adding and removing resources. Clearly, operators can manually adjust workloads using kubectl to add and remove replicas of Pods or dynamically edit their resource limits; however, several strategies have been automated. The mechanisms employed to execute these strategies are called autoscalers, which automatically update your workloads according to their own set of controls that you can apply to applications you deploy into your Kubernetes cluster. Some of these were foreseen and built into Kubernetes by the developers, while many are Kubernetes tools developed by third parties that can be employed optionally where appropriate.
Workloads in Kubernetes usually refer to a group of Pods that comprise a single entity, such as an Application, which is managed as a Deployment. Autoscaling in Kubernetes refers to the ability to update these controlling objects automatically.
1. Horizontal Pod Autoscaling (HPA)
The HorizontalPodAutoscaler (HPA) is built into Kubernetes and automatically adjusts the number of replicas of Pods scheduled on nodes in your cluster based on a defined utilization threshold.
In its simplest form, it periodically measures CPU and/or RAM utilization of a scalable Pod, and adjusts the number of replicas of that Pod in the cluster according to simple definitions, see the exmple below:
kubectl autoscale deployment apache --cpu=50% --min=1 --max=10
This will create an HPA for the apache Pod that autoscales the number of replicas running in the cluster between 1 and 10, attempting to keep the CPU utilization of each replica below 50%.
Version 2 of the autoscaling API (autoscaling/v2) provides metrics that support more than just CPU and RAM utilization as the scaling parameter, although by default, only cpu and memory are supported as resource metrics, which use the same names cluster-wide. Resource metrics can be specified as absolute values rather than percentages by setting the target as AverageValue rather than AverageUtilization, as in the example below:
metrics:
  - type: Resource
    resource:
      name: memory
      target:
        type: AverageValue
        averageValue: 500Mi
In addition to resource metrics, custom metrics can be applied to Pods and Objects to inform the HPA about what to examine when scaling workloads. Pod metrics are averaged together across Pods and compared to the specified target value to determine the number of replicas to schedule. Although similar to resource metrics, they only support a target type of AverageValue. Object metrics describe objects in the same namespace and support both Value and AverageValue target types. For Value, the metric is compared directly to the value returned by the API. For AverageValue, the value returned by the API is divided by the number of Pods before being compared to the target. You can measure specific sub-elements of the collected metrics by assigning selector labels.
In current versions of Kubernetes, you can monitor external metrics outside the scope of namespaces, as long as your monitoring solution provides them. These are similar to custom metrics in their definition, using the External metric type instead of Object. External metrics support Value and AveragValue target types in the same way as the Object type.
Before defining an external metric, it is essential that the target metric is being collected and populated by your Kubernetes cluster. In other words, before you can compare a metric against a scaling target, you must be collecting that metric somewhere in your cluster.
Custom metrics can be combined with resource metrics in a single HPA definition, and each metric will be evaluated in turn to determine how many replicas are needed to satisfy the demand. The highest number of replicas calculated to support any of the individual metrics will be used as the number of replicas to schedule.
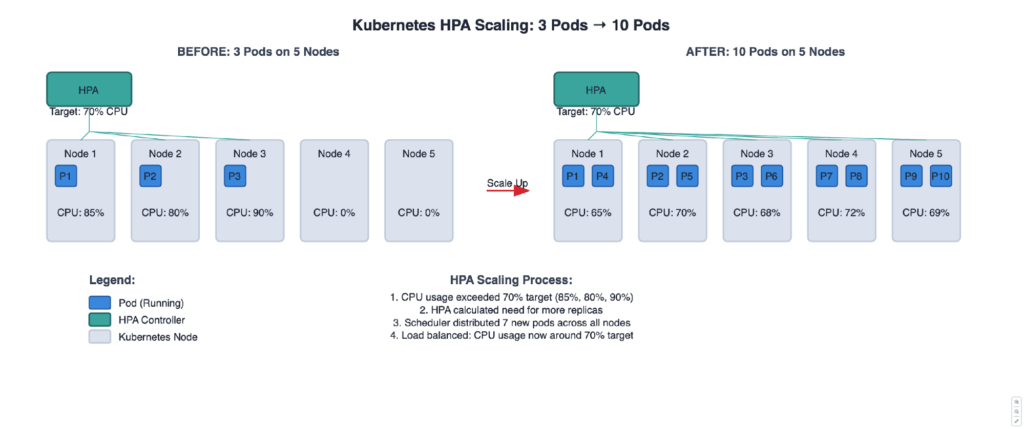
Below is an illustration of an HPA scaling a deployment across five nodes.
2. Vertical Pod Autoscaling (VPA)
The VerticalPodAutoscaler (VPA) is not built into Kubernetes, but must be installed explicitly. Once installed, the VPA provides your cluster with a mechanism to automatically change the requests and limits of your containers in their Pods based on usage. This enables the proper scheduling of workloads onto nodes, ensuring that the appropriate resources are available for each Pod. It also maintains the ratios between the requests and limits that were specified in the containers’ initial configuration. It can grow and shrink the resources being requested over time to match their usage.
There are some practical shortfalls of VPA if you are considering leveraging this technology to adjust container requests and limits.
- It is important to understand that the way the VPA scales the resource limits is by killing under-resourced containers and recreating them with the new limits in place. This means recreated Pods may be scheduled onto different nodes than their predecessors.
- Because VPA first kills the containers and recreates them with the new request/limit values, there is no guarantee that recreated Pods will actually be scheduled on the cluster, as VPA doesn’t check if there is a node large enough to accept the resized pod before it evicts the old one.
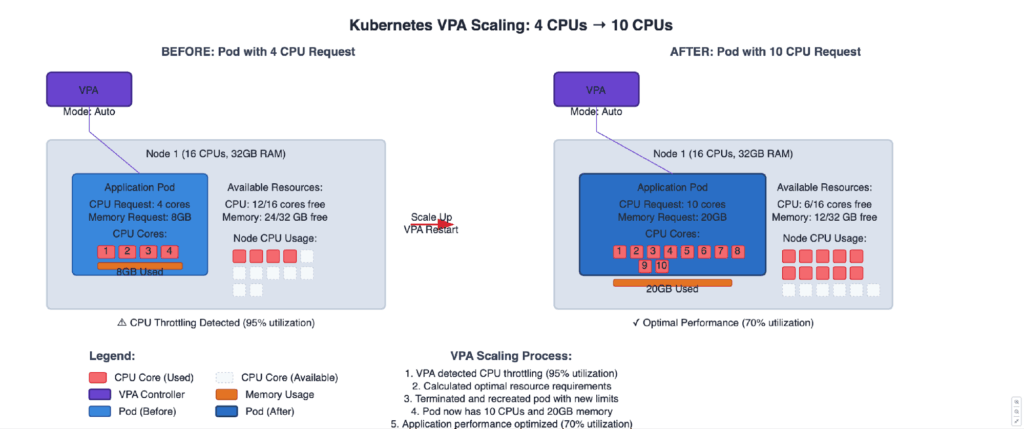
- Best practices dictate that the VPA should not be used in conjunction with the HPA set to both scale on the same metric. Below is an illustration of a VPA scaling a Pod in a single node.
3. Cluster Autoscaling
The Cluster Autoscaler (CA) goes beyond workload autoscaling of Pods and containers by actually adding and deleting nodes from your cluster based on your defined policies. This is ideal when working in a Public cloud environment, where you can simply spin up and shut down virtual nodes on demand very quickly. To enable the CA, you need to install it in your Kubernetes cluster, as it is not a built-in feature.
The core policy of the Cluster Autoscaler is that all nodes in a node group in a cluster are identical. By default, every 10 seconds, the CA looks to see if there are any unschedulable Pods targeted for a node group and then simulates adding new nodes into that cluster to see if the nodes would become feasible for those Pods. If the simulation shows that outstanding Pods would indeed be scheduled on new nodes should they become available, then the CA requests that the cloud provider spin up new nodes and automatically adds them to the node group. The CA expects new nodes to be spun up within 15 minutes; if this does not occur, it removes the requested node from its simulation. If a node fails to be added to a node group, the CA still considers the needs of other groups.
Conversely, every 10 seconds, the CA checks if nodes in a group are no longer needed. If the sum of all cpu and memory requests of all the Pods running on a node is smaller than 50% of its capacity, and all the Pods running on the node can be moved to another node, then the node is marked as unneeded by the CA. If, after 10 minutes, a node is still unneeded, it will be terminated. Unneeded nodes are terminated one at a time to avoid unexpected resource shocks to the cluster. When a node is terminated, all the Pods running on that node are migrated elsewhere; if any fail to migrate, then the termination is halted.
All the values are tunable in the configuration of the Cluster Autoscaler for a cluster, and nodes can be marked as permanent to exclude them from possible termination. You can even mark a node group as needing 0 nodes, but remember that it will take several minutes for a node to be spun up in the event of a Pod being attempted to be scheduled on that node group.
When defining your policies for workloads to be run on an autoscaling cluster using the CA, ensure that you don’t create workloads that are counter to the CA’s methodology. Anything that ties a Pod to a node or places severe restrictions on the scheduler will render the CA ineffective. Two key things to look out for are local storage (which can be used but must be disclosed to the CA in a specific manner) and affinity rules, which, due to the scheduler’s algorithm, can cause the simulations to fail to run in a usable timescale.
The CA has five different ways of handling the scaling of multiple node groups in a cluster, known as expanders: random, most-pods, least-waste (the default), least-nodes, and price (only works with specific cloud providers), as well as priority. See the project documentation for details.
The HPA can be used in conjunction with the CA to scale workloads based on demand and dynamically adjust the number of nodes in the cluster to accommodate that demand.
4. Pod Disruption Budgets
Pod disruption is the process by which Kubernetes terminates running Pods. Termination can be voluntary or involuntary. Voluntary disruptions are those initiated by the application owner or cluster administrator. These include the actions taken by autoscalers, which effectively act on behalf of the cluster administrator. Involuntary disruptions are those caused by unavoidable external influences, such as hardware failure, system error, or out-of-resource evictions, such as those caused by the OOM Killer.
To prevent unintended downtime during planned maintenance or voluntary disruptions, Kubernetes utilizes the concept of PodDisruptionBudgets (PDB), which can be created for each application and essentially sets the minimum number of replicas required for the application to function. Cluster managers and hosting providers should use tools that call the EvictionAPI rather than directly deleting Pods or deployments, to respect the applications’ PDB. Pods that are evicted using the EvictionAPI are gracefully terminated. Obviously, the system can’t prevent involuntary disruptions from terminating replicas. Still, they are accounted for in the PDB and cause Kubernetes to either spin up new replicas or stop voluntary disruptions from taking the replica count below the minimum.
When planning maintenance of nodes or clusters (such as infrastructure software or hardware updates), careful coordination of downtime with the requirements of the applications’ pod disruption budgets will enable Kubernetes to maintain the correct functioning of the applications throughout the entire period. The simplest way to do this is to upgrade each node in turn, and Kubernetes will start and stop the replicas as needed, whilst maintaining the budget.
Storage Resource Management
Various types of storage can be assigned to Kubernetes to manage on behalf of containers running on a cluster, both for long-term (persistent) and temporary (ephemeral) use. Each type has to be specifically made available to Kubernetes. They can be used either generically or specifically by workloads running on the cluster, depending on the configuration of the containers. Here we discuss the key considerations.
Persistent Volume Management
Persistent Volumes are slices of storage provisioned to the cluster as a resource, similar to nodes, the contents of which remain even when the Pods accessing them are not running, until they are deleted. Each slice is defined as a PersistentVolume (PV) in the cluster and has its own lifecycle independent of any Pod that uses it. The PV object definition contains the implementation details of the storage, including whether it is NFS, iSCSI, or a custom cloud provider storage system.
For a Pod to utilize a PersistentVolume (PV), it needs to claim it, which is done by creating a PersistentVolumeClaim (PVC) that specifies its requirements, including its size and access modes. When the PVC is created, Kubernetes finds an available PV that matches or exceeds its requirements and binds it exclusively for the life of the PVC. Note that a PVC will always get a PV at least as large as it requested, but the PV may be much larger than needed (with the excess being wasted). Optionally, you can bind a PV to your PVC by naming it specifically in the claim definition; this binding is not guaranteed if the PV has already been bound to another PVC. Once bound, a PVC is used as a storage volume by the Pod.
The Storage Object in Use Protection feature of Kubernetes maintains a list of PersistentVolumeClaims in use and bound PersistentVolumes, ensuring they are not removed from the system to prevent data loss. If a PV or PVC is deleted in the system, it is not actually removed until no Pods are actively using it.
Storage Classes and Dynamic Provisioning
Rather than always manually creating persistent volumes and binding them to Persistent Volume Claims, you can configure your system to provision PersistentVolumes as needed dynamically. To enable this in your cluster, you need to define the types of storage available and how they should be utilized. This is done by creating StorageClass objects for each type of storage and usage type. Suppose you only have a single type of storage device in your cluster. In that case, you may still want to define different usage classes for it to be used by specific usage requests, with varying usage parameters being passed to the storage provider.
When a user defines a PVC for their Pod, they can choose to specify a storage class rather than a specific PersistentVolume identifier, which will allow Kubernetes to dynamically allocate and bind a new slice of storage as a PV to that PVC.
Here is an example of fast and slow storage class object definitions, along with a claim that utilizes them.
Fast StorageClass (SSD)
apiVersion: storage.k8s.io/v1
kind: StorageClass
metadata:
  name: fast-storage
provisioner: kubernetes.io/aws-ebs   # Example for AWS EBS
parameters:
  type: gp3                         # gp3 SSD (general purpose)
  iops: "6000"                       # Example tuning for high IOPS
  throughput: "250"                  # MB/s throughput
reclaimPolicy: Delete                # Reclaim volume when PVC is deleted
volumeBindingMode: WaitForFirstConsumer
allowVolumeExpansion: true
Slow StorageClass (HDD)
apiVersion: storage.k8s.io/v1
kind: StorageClass
metadata:
  name: slow-storage
provisioner: kubernetes.io/aws-ebs   # Example for AWS EBS
parameters:
  type: st1                          # HDD (throughput optimized)
reclaimPolicy: Delete
volumeBindingMode: WaitForFirstConsumer
allowVolumeExpansion: true
And this is an example of how to create a PersistentVolumeClaim for a 30GiB persistent volume slice of the fast type storage:
apiVersion: v1
kind: PersistentVolumeClaim
metadata:
  name: claim1
spec:
  accessModes:
    - ReadWriteOnce
  storageClassName: fast-storage
  resources:
    requests:
      storage: 30Gi
The example claim results in a 30 GiB persistent SSD volume being automatically provisioned, which will be automatically destroyed when claim1 is deleted.
If you wish to enable dynamic provisioning by default in a cluster, even if no storage class is specified, you can mark one StorageClass object as default, and enable the DefaultStorageClass admission controller in the API server of your Kubernetes deployment.
Volume Capacity Planning
Unlike CPU and RAM resources, storage cannot be over-allocated in a cluster. In other words, once your scheduled Pods have consumed the available storage of any given type, no more Pods requiring that storage type can be scheduled [technically, they can be scheduled but will never be actually deployed to a running node until enough storage becomes available]. This means that you need to carefully plan how much of each storage type will be required to run all the Pods that need to use it, including all replicas in an autoscaling deployment.
Some storage types are actually hosted on local nodes in a cluster themselves, and this also needs to be taken into account when planning capacity; you could end up in a situation where a Pod needs so much of the local storage on a node that no other Pods can be scheduled to that node, possibly resulting in wasted CPU and RAM resources in the cluster.
When Kubernetes was originally conceived, the developers built mechanisms to access specific storage devices and facilities directly into the code. In recent versions of Kubernetes, the developers realised that a much better mechanism for accessing proprietary storage systems is to use a standard storage API and have the vendors of those storage systems create and maintain their own drivers to access and manipulate their storage systems. This API is called the Container Storage Interface (CSI), and is defined here.
To utilize vendor-specific storage systems, you deploy the relevant CSI-compatible volume driver in your Kubernetes cluster.
Network Resource Management
The nature of cloud-based workloads, as managed by Kubernetes, is that they are remote from the users and thus need to be accessed entirely via the network. One of the most fundamental aspects of Kubernetes is that it manages the networking between containers, Pods, services, daemons, nodes, and, ultimately, the applications themselves. Kubernetes provides facilities to users, developers, and operators that make the process mostly transparent to users and developers. This transparency makes it an even more important consideration for Kubernetes resource management.
Network Policies
In keeping with the modern Kubernetes ethos, the developers have encoded APIs for networking; most of the networking facilities provided by Kubernetes are actually handled by external Kubernetes tools, most notably CNI Plugins. If you want to manage traffic at the IP address or port level, you can define Network Policies that specify rules for traffic flow within your cluster, as well as between Pods and the external network. To do this, you must use a CNI plugin that supports NetworkPolicy enforcement, such as Calico. Note that the popular plugin, Flannel, does not enforce NetworkPolicy.
There are three identified types of object that can be specified in a network policy: (1) Pods, (2) Namespaces, and (3) IP blocks. You can define separate rules for ingress to and egress from a Pod; by default, all inbound and outbound connections for a Pod are allowed. You can continue to add new network policies, and each rule is evaluated before access is granted. In other words, before a connection is allowed to be established, all the rules related to that Pod are evaluated, and if none of them prohibit that connection, the connection is allowed. Of course, allowing the connection for one Pod does not guarantee that another Pod’s network policies will also allow that connection to be established between them.
Bandwidth Limitations
Many factors affect the network bandwidth available to your applications.
Traffic between containers in a Pod is primarily limited by the CPU cycles required to execute the virtual network stacks and the kernel operating the node itself. This can be mitigated to a large degree by employing CNI plugins that use the modern Linux kernel Berkeley Packet Filter (BPF) or eBPF networking modes, such as Calico and Cilium.
Traffic between nodes is limited by the number and speed of the NICs in the node, the speed of the network infrastructure, and the capacity of the switches in the physical network. Traffic between Pods on different nodes is affected by the Pod network stack and the physical network between the nodes. If two Pods in an application generate high network traffic, it may be optimal to place them on the same node, which can be achieved by using affinity rules for the Pods.
Traffic between your applications and the external network is limited by all the other factors, with the additional limitations imposed on your allotment of network bandwidth allocated by your service provider. In practice, the network service level you contract for with your cloud provider is likely to be the most significant bandwidth limitation affecting your ability to service your clients.
Service Mesh Considerations
In some Kubernetes clusters with multiple applications running, deploying a service mesh is a necessity. By its very nature, a service mesh introduces operational overhead that can lead to resourcing issues. At its most basic level, a service mesh will consume additional CPU and RAM from each node. It will also generate additional traffic and introduce latency to the networking between Pods, which may adversely impact certain workloads, such as real-time systems.
Consider which features of your chosen service mesh you actually need; perhaps switch off some features for namespaces that are resource sensitive. In large clusters, consider the network load that will be generated by synchronising distributed service mesh proxies. Avoid unnecessary packet processing overhead caused by enforcing network policies at two layers; consider enforcing a policy at either the CNI level or the service mesh level, rather than both. Monitoring and telemetry services will use storage, which needs to be accounted for in the planning of your applications.
Ingress Controller Resources
Before your cluster allows connections from the external network (most notably, the internet) to Pods, you need to enable at least one secure path for inbound traffic to your cluster. An ingress controller is the most common method of doing so. Although some basic ingress controllers are included in Kubernetes, most ingress controllers are external Kubernetes projects. You may install and enable more than one ingress controller in your cluster, but be careful to select the desired controller when defining the ingress rules; otherwise, they will use the default ingress controller.
Ingress Controllers are likely to be superseded by the new Kubernetes Gateway API tools, which perform more than just the base service of Ingress Controllers. In fact, many of the Ingress Controller projects have already moved to the new model.
Monitoring and Observability
Monitoring and Observability are critical to Kubernetes resource management. Kubernetes itself generates metrics in the Prometheus format, which can be used to study the behaviour of the clusters themselves. The service mesh provides metrics on the performance of the applications.
Key Metrics to Track
Each node in a cluster has a finite set of resources, but some of these can be shared simultaneously between workloads. Kubernetes anticipates that not all these resources will be needed by all the workloads all of the time, and schedules Pods to nodes accordingly. The key metrics to measure to identify potential or actual issues are CPU and RAM utilization in a node.
Kubernetes can report two sets of metrics that should be monitored for effective resource management:
- kube-scheduler metrics
- reports the requested and defined limits for resources of all running Pods
- kublet Pressure Stall Information (PSI) metrics
- introduced as a beta feature in Kubernetes v1.34, reports the kernel level metrics for CPU, RAM, and I/O usage for Pods, containers and the nodes themselves.
Key metrics to track are:
- how long it takes for a feasible node to become available for Pods and how many Pods are unable to be scheduled owing to the lack of resources. This is a critical indicator of a cluster under pressure.
- Pods evicted by OOM Kills, which indicates poorly managed Pod resource requests and limits, not enough nodes in the cluster, or not enough RAM in the nodes to support the workloads.
- network lag between applications and their users. High latency between the users and the applications suggests bottlenecks somewhere in the cluster that should be investigated.
The obverse of resources under pressure is wasted resources. If all the Pods are scheduled all the time with no OOM kills, it could be that you have more resources than required in your cluster. Perhaps you could remove some nodes and stop paying for them.
If you have Pods with resource limits set significantly higher than their requests, it could be that they are allocated more RAM or CPU than they need to operate at normal levels. These excessive limits may cause no issues in a cluster not under pressure, but they could be consuming more resources than actually required. As before, perhaps you could remove some nodes and stop paying for them.
Another key area of potential waste is persistent storage claims that utilize persistent volumes larger than necessary. A PVC of 30 GiB bound to a PV of 100 GiB means that 70 GiB of persistent storage is wasted.
Monitoring Tools and Dashboards
One of the oddest things about Kubernetes, to most people, is that it does not provide a dashboard by default; if you want it, you have to deploy it specifically. In fact, this is a design advantage, as it allows you to install and deploy your own monitoring tools and dashboards in place of the basic one included in the Kubernetes codebase.
There is a wealth of options, but the most common solution is to install the Kubernetes tools Prometheus and Grafana and to configure dashboards that show the information most important to them.
The most important thing is to ensure that your metrics are gathered and stored in a time series format that allows for examination at a later date.
Alert Configuration
Most monitoring tools allow you to set alerts that trigger upon some defined event. This will enable you to be alerted should key metrics cross a set threshold.
Suggested alerts are:
- Number of Pods that have been unable to be scheduled for a time; this indicates a cluster under significant pressure or someone trying to deploy unrealistic workloads.
- Many OOM Kills are occurring in a time period; this could indicate significant memory pressure in your cluster or containers with memory leaks in their code.
- Response latency over a limit for your application; if the latency exceeds a limit for an application to respond to its users, there could be problems in the environment.
- Unexpected node failure; if a node suddenly goes offline, it most likely signifies an involuntary disruption that needs to be handled.
Capacity Planning
Monitor your cluster to see which resources are under pressure. Use this information to plan adding or removing capacity from your cluster. This could range from adding more CPUs or RAM to your existing nodes, adding new nodes to the cluster, or even removing nodes if you have significantly wasted resources and no immediate expectation of increased demand. The key thing to keep in mind when capacity planning is the anticipated changes in demand on the applications, especially those that can autoscale their replicas. The worst-case scenario would be to right-size your cluster for the moment, but forget to reserve capacity for autoscaling applications. Calculate the required resources for the maximum number of all replicas of all Pods to be scheduled simultaneously.
Best Practices for Kubernetes Resource Management
1. Start with monitoring baselines
Use your monitoring tool to identify resource constraints and trends. An effective way to set your resource requests and limits for your Pods is to configure them to run unbound in an unstressed cluster and monitor their performance. After a while, they will reach a steady level of resource consumption that you can measure and then define as resource requests and limits.
2. Implement gradual limits
Rather than immediately setting the requests and limits to their minimum and maximum observed values, set generous values initially to assess their impact on the cluster’s stability. Maintain observation and gradually adjust the values over time until you reach the required performance level of the workloads with the most tightly bound resource requests and limits. Setting resource requests equal to their limits gives the highest QoS for scheduled Pods.
3. Use namespace isolation
Organize your users and applications running on your cluster into sensible groups, such as development and production, engineering and marketing, etc. Define namespaces for each group, with appropriate resource requests and limits. Configure security contexts for each namespace to ensure that their users and workloads are isolated from each other and cannot access namespaces out of their scope.
4. Regular resource audits
Using your monitoring and observation tools, configure reports that show the utilization of resources you want to observe. Run these reports routinely and compare the results to identify trends.
5. Documentation and standards
Although Kubernetes resources can be written in several different ways for the same type of resource, we recommend maintaining a standard nomenclature across your deployments and documentation. For example, only specify CPU resources as either 0.5 or 500m across the board for your deployment. For deployments working with slices of single CPUs, uniformly adopting the milliCPU form can help avoid errors in positioning the decimal point. As RAM is configured in the traditional power-of-two boundaries, pay attention to using the correct quantity suffix for the intended deployment.
6. Team training and governance
Kubernetes resource management is a complex endeavor with many tunable parameters and possible adjustments. Without clear governance and team leadership, it is all too easy for different team members to make conflicting or unharmonious adjustments, which can result in suboptimal outcomes. Ensure that each operator is fully trained in all aspects of both Kubernetes administration and the Kubernetes tools they are assigned to work with.
In a dynamic, resources-on-demand environment such as Kubernetes clusters, the easy option is to over-allocate resources to your workloads in the hope that they will perform their tasks as planned. Similarly, it is easy to leave unused workloads running and consuming resources once put out of mind. It is crucial to assign the responsibilities for resource request sizing and workload lifecycle management to specific team members or roles and ensure that they understand the consequences of poor sizing decisions. Conversely, make it clear that no other team members or roles should be making those decisions.
Common Kubernetes Resource Management Pitfalls
Here we highlight some of the common pitfalls that can befall Kubernetes clusters.
Over-provisioning Resources
It is human nature to seek the quickest path to an endpoint, especially when activities are tied to deadlines. When sizing a workload, it is easiest just to give it the maximum resources available in the expectation that it will operate as hoped. Similarly, it is easiest just to order the biggest machines available to you to run your cluster. Human intuition also tends towards adding extra resources, if they are available, “just in case”. We have observed many occasions when the number of nodes allocated to a cluster is based on the total budget available, or even the maximum sign-off level of the person placing the order. While this may seem optimal at the time, the usage-charging model of cloud services means that you could easily exceed your budget.
Ignoring Burst Patterns
Kubernetes is a platform on which you can run many and varied workloads on shared resources. This, of course, is its power, but also a potential pitfall. New workloads can be added at any time, and the usage of workloads can change at any time, too. One of the key advantages of Kubernetes is the mechanism for applications to scale dynamically, based on various criteria. When managing the resources in your cluster, you need to take into account the possible autoscaling of the workloads. One option is to simply over-provision the available resources, but this may incur unnecessary expenses. The alternative is to monitor your Kubernetes clusters and applications, running regular reports and comparing the usage patterns. Identifying patterns of increased demand on specific workloads and examining their resource utilization will allow you to plan for adequate amounts of the identified shared resources to be available at those times.
Insufficient Monitoring
Dashboards can be beautiful and visually compelling; one can imagine a room with a huge screen showing dials and graphs reporting the activity of your Kubernetes clusters as it happens, with people hovering over keyboards ready to pounce into action at a moment’s notice. This is great for real-time reaction to live events, but not necessarily useful for Kubernetes resource management. Defining and regularly running routine reports that examine resource utilization will enable you to identify gaps and trends, informing your resource management decisions. Another pitfall is the failure to monitor all the resources that matter to your workloads. For example, you may be on top of CPU and RAM utilization in your nodes, but fail to identify that the service provider is throttling your application because you have reached a gated resource limit, such as storage IOPS or internet network ingress requests.
Poor Namespace Organization
As we noted previously, namespaces are perhaps the single most important aspect of Kubernetes. When starting your Kubernetes journey, it is all too common to create a namespace for every workload or application. This may seem good and proper and may not be an issue initially, or possibly at all in minimal environments, but it can lead to unexpected complexity and resource overhead. Even setting aside security aspects, each namespace can have its own resource requests and limits that must be managed individually.
The other extreme of having either a single, default namespace or very few arbitrary ones means that resources need to be managed at the Pod level, again potentially leading to huge administration overhead and poor resource management.
Tools for Kubernetes Resource Management
Out of the box, Kubernetes resource management is accomplished by virtue of editing the configuration files for containers, Pods, Namespaces, and storage claims, and applying them using kubectl. Utilization metrics are gathered and stored in Prometheus format, and a basic dashboard can be deployed for observation and monitoring.
The HPA is the built-in autoscaler for Kubernetes, which manages the number of replicas for workloads and attempts to spread them across the available nodes in the cluster. It uses the Kubernetes Metrics Server to inform the HPA of CPU and RAM resource availability every 15 seconds. Note that the metrics-server needs to be specifically installed and enabled in your cluster. It can also provide resource usage metrics to the VPA; however, be aware that it should not be used for detailed monitoring or observation, as it prioritizes performance and scalability over accuracy.
For users with more extensive Kubernetes deployments, several commercial companies offer dedicated Kubernetes Resource Management tools, some of which utilize AI to help optimize resource utilization and cost optimization for running clusters. These tools go beyond autoscalers and monitoring tools to provide advanced resource utilization optimization in live environments with minimal human involvement.
Kubex by Densify
Kubex by Densify is a commercial Kubernetes resource management and optimization solution for Kubernetes that focuses on identifying and automating resource optimizations in Kubernetes clusters running on public cloud service providers or on-premises. Kubex analyzes the cpu and memory utilization of all the containers in your clusters as they run, comparing them with the requests and limits assigned to them. It builds a picture over time of the actual resource requirements of a workload running in Kubernetes.
See the table below for a comparison of Kubex automated resource optimization and Vertical Pod Autoscaler (VPA)
| Feature | VPA | Kubex Automation Controller |
|---|---|---|
| Pod Eviction | Must evict pods in order to resize them | Option to not evict pods, they are resized as they are restarted as part of normal operations. Opt-in setting to evict running pods if desired. |
| Compatible with HPA | No, do not scale on same metric as HPA | Yes, will detect what metrics HPA is scaling on, and not attempt to scale on those same metrics |
| Node size checks | Does not check the resized pod can fit on a node before evicting it | Verifies the resized pod will fit on a node prior to evicting it |
| Granular control | Either enabled, or disabled for a workload | Automation can be toggled, but also fine-grained control over what actions to take. For example, “Only do upsizes” or “Only upsize memory” or “Remove CPU limits if they exist” |
| Workload types | Supports Pods, Deployments, ReplicaSets | Supports Pods, Deployments, ReplicaSets, StatefulSets, Daemonsets, Jobs, CronJobs, Argo Rollouts |
| Historical Data | Up to 8 days | Configurable. Default 90 days. |
| Supports resize-in-place | On Kubernetes 1.33 and later | On Kubernetes 1.33 and later |
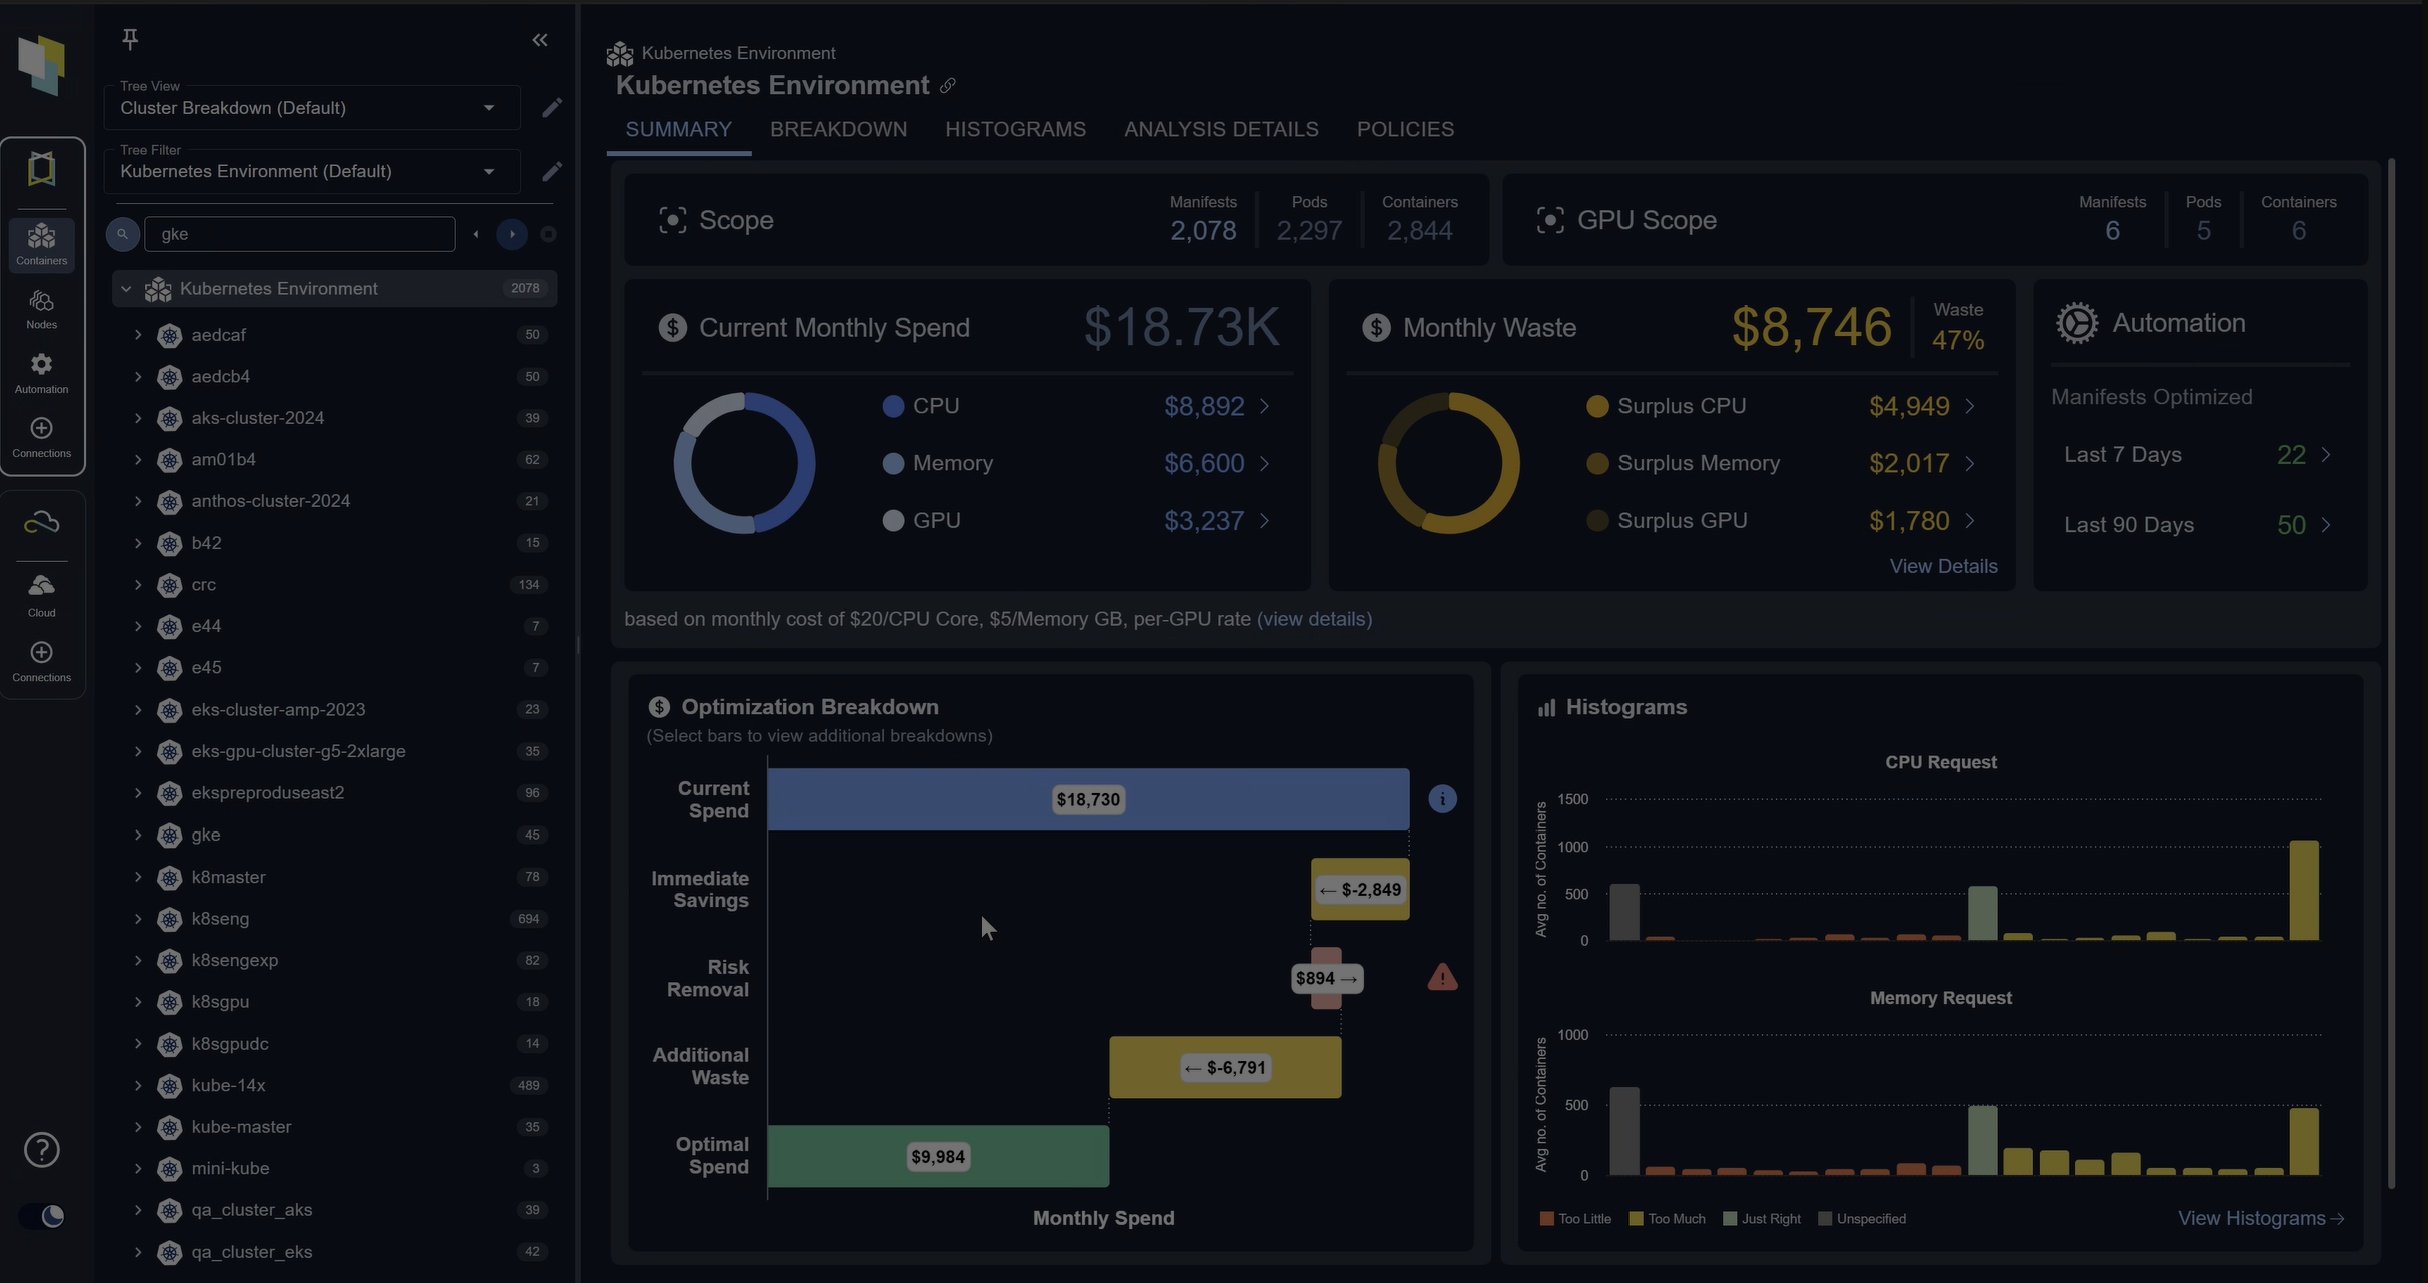
Kubex employs AI and machine learning to find the optimal resource requests and limits for each container. The graphical dashboard pulls the data together into clear, actionable recommendations. The top level displays your estimated operating costs for the cluster or clusters in your environment, highlighting how much it estimates you can reduce your costs by, and lists the top applications with the most considerable potential for cost reduction or where there is operational risk due to undersized resources.
Drilling down into the dashboard, you can see graphs for each container, and have Kubex show you how it would configure the cpu and memory requests for each container to optimize its performance and utilization, and reduce the risk of involuntary disruptions caused by resource exhaustion. The ultimate power of the tool lies in its ability to flick a switch and have Kubex automatically set the optimal resource requests and limits for each container by utilizing the Densify Mutating Admission Controller for Kubernetes, which directly integrates into your cluster using the official Kubernetes APIs.
Resource Management in Production
Multi-Tenant Considerations
Kubernetes was not initially designed for multi-tenancy deployments in the way that public cloud service providers are. This means you need to pay close attention to security and operational controls, as well as resource management, should you plan to operate a multi-tenant cluster.
Key considerations for multi-tenant Kubernetes deployments are: – Isolation: Organisze tenants by namespaces and enforce network and container privilege policies, along with Role-Based Access Control (RBAC) – Resource Management: Enforce namespace resource requests and limits to limit the maximum total resources that all Pods and containers in that namespace can request/use. – Networking: Ensure that one tenant’s traffic is not visible to another, primarily by implementing CNI isolation (at the IP level), and consider using shared versus per-tenant Ingress or Gateway API controllers. Some CNI plugins support tenant-aware policies, e.g., Calico. – Security and Compliance: maintain forensic secret management, and consider external secret tools (often supplied by public service providers). Maintain comprehensive logging and auditing, but isolate tenant visibility to its own data. – Data protection: Persistent volumes must be isolated, even down to separate storage backends, unless they are explicitly designed to enforce isolation. Consider encryption at rest and in transit (end-to-end). Consider the impact of backing up multiple tenant data onto the same tape or other device.
Another consideration for multi-tenancy is that your clusters may ultimately be sharing resources with other customers on your chosen cloud hosting provider. Poor management by the provider could affect your performance unless you have agreed service level guarantees.
Cost Attribution
A production Kubernetes environment is likely to be operated on a public cloud, even if it’s just to boost an on-premises environment. Each resource you use in a public cloud has a cost/unit, some of which may accumulate even if you are not actively running workloads. In reality, there is also a cost/unit for everything in an on-premises environment, but this may be hidden from your cost center. In small environments, you may be able to use your monitoring tool and a spreadsheet to work out your costs, but this quickly scales beyond a practical solution. Using a tool such as Densify will enable you to view both your actual and projected costs, helping you maintain control over your operational budget.
Compliance Requirements
Being, by its nature, cloud-based and dynamic, a Kubernetes deployment is something of a movable feast. Workloads can find themselves running on multiple locations, even geographically, with multi-zone Kubernetes environments. This affords maximum flexibility, but you need to pay attention to commercial, legal, and governmental regulations that impact those workloads.
Compliance pitfalls include: – Sovereignty: specific data may be required to remain in particular jurisdictions or even countries. Examples include personal identifiable information, bank records, and health records. – Commercial sensitivity: users may contractually require that the data they host or process on your Kubernetes nodes remain secret, highly isolated, or always persistent. – Availability: if you agree to service level agreements, you are obligated to provide the necessary facilities for them within your Kubernetes deployment. Examples include applications that are always accessible to users, data that can never be lost, or applications operating within a specified latency limit. – Legal: police or government agents may have the authority to exercise particular rights, which you are legally obliged to facilitate.
Disaster Recovery Planning
Kubernetes is designed to provide highly available and scalable operating platforms for applications, but any single cluster is always susceptible to involuntary disruptions, even when running on a public cloud service. Pay attention to how you would provide service to your clients in the event of a complete cloud provider data center failure. This may be as simple as spreading your cluster across multiple provider zones, but be sure to replicate persistent data across data centers, cloud zones, or cloud providers.
Spend less time optimizing Kubernetes Resources. Rely on AI-powered Kubex - an automated Kubernetes optimization platform
Free 30-day TrialConclusion
Kubernetes resource management is an essential competence for operating anything other than minimal deployments. The two resources most likely to constrain a Kubernetes cluster are CPU and RAM, and these are the critical levels that affect the cluster’s ability to schedule workloads to run. If you set unachievable requests for a workload, it will never actually run on any node; if you configure too restrictive requests, you may experience performance degradation, CPU throttling, or Out-Of-Memory (OOM) kills. Kubernetes automatically creates or deletes replicas of workloads to meet the real-time demands placed on it; if you don’t have enough CPU and RAM available in the nodes in your cluster, it won’t be able to do this effectively. Autoscalers help Kubernetes spread workloads across nodes in a balanced way, or even to add to and remove nodes from your clusters. The combined result of these features is that CPU and RAM resources fluctuate over time, sometimes considerably and rapidly, which requires continuous optimization to ensure smooth and reliable operation of Kubernetes.
There are third-party Kubernetes tools to help you manage resources in your deployments. Tools such as Kubex by Densify utilize AI and machine learning to dynamically optimize resource consumption dynamically, reducing operational costs and the risk of involuntary disruptions.
Try us
Experience automated K8s, GPU & AI workload resource optimization in action.
Try us
Experience automated K8s, GPU & AI workload resource optimization in action.