Working with Sensors
Working with Sensors
#230500
The Control Console supports the display and management of sensors, allowing you to visualize sensors in the Spectrum and react to sensor-specific recommendations. Sensors can be used for routing future workload reservation requests.
This topic provides an overview of how to manage your sensors.
Sensor Types
Densify is shipped with the support for datastore sensors, which are audited through the data collection for VMware systems.
Defining Sensor Placement Strategy
You have two sensor placement options when routing workloads:
- Balancing Strategy—Distributes incoming workloads across all suitable hosting venues with available sensor capacity. Using this option the resource with available sensor capacity that also matches the fit-for-purpose requirements of the incoming workload and has the most available capacity among all matching candidates is selected. Densify attempts to balance workloads across all available hosting venues. This is the default behaviour.
- Fill and Spill Strategy—Fills suitable hosting venues with available sensor capacity with incoming workloads until the resource reaches its threshold. When routing, the workloads with matching fit-for-purpose requirements are placed on the resource with the least capacity, first.
You can specify sensor placement strategy when submitting a routing request via the API or you can set the placement strategy globally using a configuration setting.
Note: If a preferred datastore is set, then that setting will override the sensor placement strategy (i.e. balanced/fill and spill).
Refer to the API documentation for details on creating a routing request that includes specifying a sensor placement strategy. See
Displaying Sensors and Recommendations
The Spectrum provides a Sensor Display button that toggles the display of the sensors included in your control environment. This button displays a health icon with the worst health value of all sensors in the environment. A health icon is also displayed on each tab indicating the worst health of the sensors shown through that tab.
See Control Console Spectrum Overview for more details on the sensor display in the Spectrum.
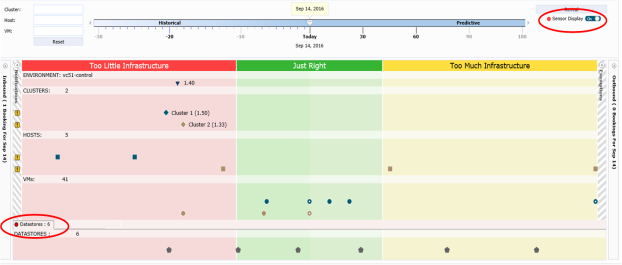
You can zoom in/out of any Spectrum area, whether it be a horizontal or vertical area. If you hover over a sensor, the name of the sensor is displayed in a tooltip with the number of hosts and VMs associated with the sensor in brackets (e.g. ds1 [3]).
When you select one or more sensors in the Spectrum, the Spectrum Details is updated with the following two tabs:
- Recommendations—displays recommendations for the selected sensors (see Reviewing Recommendations for details)
- sensor type—provides details for the selected sensors, including the metrics for those sensors (see Spectrum Detail for details)
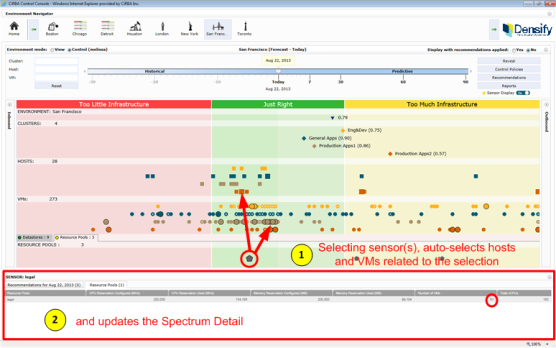
You can search and select sensors through filtering and Reveal of associated infrastructure groups, hosts and VMs. You can also select one or more sensors and see the hosts and VMs that use those sensors. Filtering directly by a sensor is not supported. For more details, see Working with the Spectrum and Search and Filter.
From the Control Console home page, you can see the sensor count, e.g. the number of datastores pertaining to a control environment with the hover over tool tip. See Navigating the Control Console for details.
Placement within the Spectrum
The position of each sensor is based on how well it meets the high/low setting limits defined in the policy. For example, datastore sensors have Used Space, Provisioned Space and Required Space High/Low Limits.
A sensor can be positioned at the far left of the Spectrum (at 100% full) or at the far right (at 0% full or 100% empty).
Table: Sensor Placement
|
Spectrum |
Description |
|---|---|
|
Too Much Infrastructure |
A sensor is positioned in the Too Much Infrastructure section when all metrics are below the corresponding policy setting low limits, or some metrics are below but others are within the corresponding policy setting low/high limits. For example, for sensors with two metrics:
|
|
Just Right |
A sensor is positioned in the Just Right section when the metrics are within both corresponding policy setting limits. For example, for sensors with two metrics:
|
|
Too Little Infrastructure |
A sensor is positioned in the Too Little Infrastructure section when at least one metric is above its corresponding policy setting high limit. For example, for sensors with two metrics:
|
Historical data is not retained. When the timeline is set back in time, the sensor area is removed from the Spectrum (and the Sensor Display toggle is disabled).
For VMware datastores, their placement also accounts for disk usage metrics collected from the VMware VMs. Densify analytics calculates the datastore available capacity and determines whether or not there is sufficient capacity for existing VMs, and whether or not more VMs can be safely added to the datastores. For predictive timeframes, the required disk space is calculated based on the historical growth trend, headroom and age of the VMs. As you move your timeline into the future, the datastore sensors move as the projected disk space usage for VMs change.
Bookings and Sensors
When bookings are incorporated in the environment, the projected placement of the sensors is calculated with bookings in mind. Basically, the sensors' metrics for the timeline is defined to be that defined by the sensors for today, plus that defined by inbound bookings. Outbound bookings are not taken into account for a conservative approach. If there are no bookings defined, then the sensor placement does not change as you move the timeline except for datastores as described above.
When defining VM bookings, the Guest's Resource Request category of the Guest Booking Request dialog (from the Route and Reserve Demand page) allows you to define your multi-disk allocation requirements. For host bookings, the host is assumed to be connected to all datastores for the environment so that VM bookings can be appropriately added.
As inbound host and VM bookings are incorporated in the environment, as you move your timeline into the future, datastore sensors are updated with the bookings as follows:
- each metric of the specified sensor is decremented by the corresponding metric specified in the booking
- the sensors' host or VM count is incremented by 1.
Note: The inbound VM bookings created through transformation analyses are defined with one storage disk and may not include the provisioned space and used space. You must edit the bookings before you submit them to define multiple disk definitions, configure the storage tier definitions or update the space metrics.
Datastore Bookings
Inbound datastore bookings can be defined to model datastores coming online in the future. These future datastores are available when defining host and VM bookings. They are also incorporated in the environment as sensors as you move your timeline into the future.
Recommendations
Recommendations, that require further investigation, are generated when the sensor is in the Too Little Infrastructure section of the Spectrum.
The recommendation types are as follows:
- If the high limit threshold set in the policy is breached (e.g. provisioned, required or used space, or the number of VMs), the recommendation is "Investigate sensor entity exceeding limit"
- If the capacity limit is breached (e.g. provisioned space), the recommendation is "Sensor entity is full"
See Reviewing Recommendations for more details including examples of the recommendations.
Additional Routing Considerations
At the end of each control environment refresh, existing data used for routing bookings is purged and recalculated (sensor recalculation). This data includes:
- Aggregate infrastructure group-level capacity data, including storage per-tier capacity, cluster_sensor_capacity;
- Individual sensor-level capacity;
During the period while this recalculation is performed, routing anomalies can occur. Specifically, while the sensor data is purged and then is temporarily unavailable for a given hosting venue. During routing of incoming workloads, any clusters that are in the state of sensor data recalculation are excluded from consideration as a hosting option.
You can specify sensor lockout behaviour when submitting a routing request via the API or you can set the lockout during recalculation, globally using a configuration setting.
Optional Metrics
If a metric is optional and is not available during an audit, "N/A" is displayed in the reports and the metric is skipped in calculations and routing decisions.