Working with the Spectrum
#230180
Note: When using the simplified version of the Control Console in browsers other than Internet Explorer some features may not be available. See
You can select one or more systems in order to access specific Spectrum functionality Once selected, the system dots increase in size. You can now drag them to the required option on the pop-up drop zone pane. The pop-up pane is displayed when you begin dragging the selected systems. After you drag the selected systems to the appropriate drop zone option, a dialog box is displayed to configure and confirm the requested operation.
Depending on the scope of your selection (environment, infrastructure groups, hosts and/or VMs), the icons in the drop zone pane will differ. Only the options that are applicable to the type of selection are provided. If options are not valid for the access control, they are displayed but disabled (i.e. showing in gray).

Specifically, the steps to perform a drop zone operation are:
- Determine the environment, infrastructure group, or group of hosts and VMs you want to select. Optionally, zoom into the area of the spectrum containing the systems you want to select. As you hover over a system, the system name is displayed.
- Drag the mouse around the systems to be selected. You can select systems that are not adjacent, by holding down the Ctrl key, while selecting the various systems. As you select the systems, the corresponding dot is enlarged for easier viewing. You can specify the desired dot size. See Shortcut Keys. Click anywhere in the Spectrum to deselect the whole group and then reselect, as necessary.
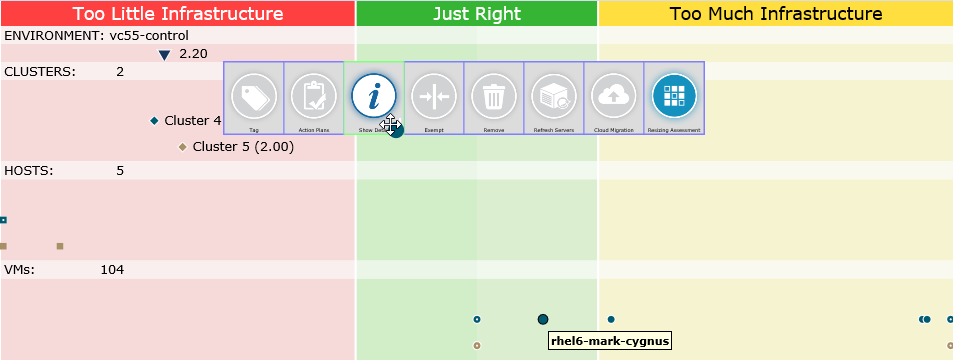
- Drag the selected systems towards the top of the Spectrum. As you begin dragging, the drop zone pops up. Alternatively, press F2 to keep the drop zone on top of the Spectrum. It will not disappear.
- Drag the systems to one of the drop zone options and release the mouse button. The corresponding dialog box is displayed.
- Click the Systems tab to see the list of selected systems. Verify these are the required systems. De-select any systems that you do not want to select.
- Click OK to execute the selected operation.
With the Control Console, you can perform the following operationd using the drop zone:
Table: Control Console drop zone
|
Icon |
Option |
Description |
|---|---|---|
|
|
Tag |
Tags systems to create action plans. |
|
|
Action Plan |
Creates action plans for selected systems. |
|
|
Show Details |
Shows system details for the selected systems. The report shows specific information for a selected host or VM. See Show Details below. |
|
|
Grant Exemption |
Excludes the selected system from the analytics that is causing it to be in the red or yellow area of the Spectrum. This may be used for systems with known issues. |
|
|
Remove System |
Defines the selected system (either a host or VM) as an outbound system. |
|
|
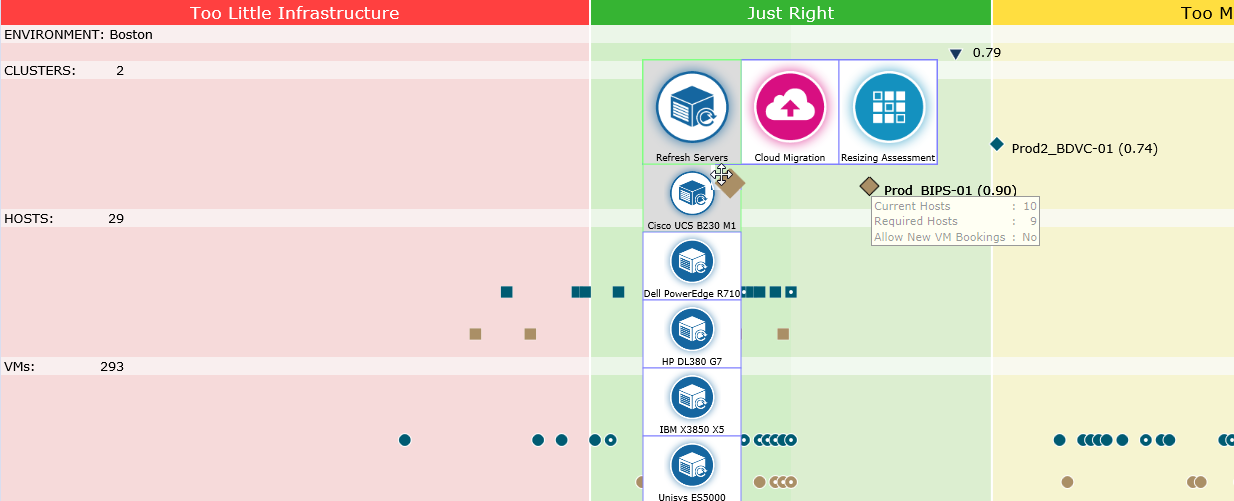
Refresh Servers (P2P) Cloud Migration Resizing Assessment |
Launches a new transform scenario on the selected environment, infrastructure group, or group of hosts/VMs onto a new set of host hardware. The options are dynamic, depending on which transform analysis packages you installed and which type of systems are selected based on platform (e.g. the transform for PowerVM options are not displayed for VMware systems). |


You can see the system details of a host or VM by selecting and dragging the system to the Show Details icon in the drop zone. If multiple systems are overlapping you can drag the composite dot and then select the single system of interest from the Select System dialog box.
The System Details report provides the following information:
- 1. Efficiency and Risk
- A. Spectrum Diagram
- B. Violations
- C. Recommended Actions
- D. Exemptions
- 2. System Details
- A. VM Summary (host report only)
- B. System Attributes
- C. Business Attributes
- D. Metrics
- Host Report includes: CPU Utilization, Memory Utilization in Percent, Disk I/O Bytes (%limit), Disk I/O Operations, Network I/O Bytes (%limit), Network I/O Packets, Disk I/O Average Latency, Disk I/O Maximum Latency, Memory Ballooning, Memory Active (%)
- VM Report includes: CPU Utilization, CPU Ready Time (%), Actual Memory Utilization in Percent, Disk I/O Bytes, Disk I/O Operations, Network I/O Bytes, Memory Ballooning, Memory Active (%)
- 3. Appendix: Policies Applied
- A. Default Cluster Level Policy Settings
- B. Cluster Level Policy Override Settings
- C. VM Level Policy Override Settings