Spectrum Detail
Spectrum Detail
#230150
Note: When using the simplified version of the Control Console in browsers other than Internet Explorer some features may not be available. See
The following features, specific to the Spectrum Detail pane are only available for advanced users when using a supported version of Internet Explorer:
- The System Dashboard button opens the system summary dashboard. All dashboard tabs and buttons are available for advanced users only, as are the link to set benchmark overrides and the links to parent and child systems.
- The Action Plan Manager button, located on the right side of the Spectrum Detail pane;
- Resource Utilization Metrics tab—The workload charts displayed here utilize the new "candle stick" format. When you open the Workload Viewer using the Workload Viewer button, the chart uses the previous box-plot format.
- Within the Spectrum Details pane, all hyperlinks to other systems, where available in the various tabs, are available for advanced users only.
When viewing the Spectrum Detail, if all the tabs do not fit in your browser window, an arrow at each end of the tab title bar allows you to slide the tabs left or right into view. Another arrow at the end of tab title bar displays a popup list from which you can pick a specific tab.
Selected Systems in the Spectrum
The Spectrum Detail area is populated with details for the systems you select in the Spectrum:
- If you select an infrastructure group then the details for all of the contained hosts and VMs are displayed.
- If you select a host then the details for the host and all contained VMs are displayed.
- If you select a sensor then the details just for the sensor are displayed.
- If you select a group of systems by dragging the selection box or by using Ctrl + click to select multiple systems, then the details for only the selected systems are displayed, and not their contained child-systems.
- If you can navigate to another control environment, the selected tab does not change. This allows you to easily view the information for a specific tab across environments.
Note: The sensors for datastores are unique to the Control Console package for VMware.
Spectrum Detail Tabs
Depending on what systems are selected within the Spectrum, the Spectrum Detail shows the corresponding tabs that apply to that selection (i.e. whether an environment (E), infrastructure group (G), host (H), VM (V), or sensor (S)).
Table: Spectrum Detail Tab Descriptions
|
Tab |
Applies to |
Description |
||||
|---|---|---|---|---|---|---|
|
E |
G |
H |
V |
S |
||
|
Action Plans |
E | G |
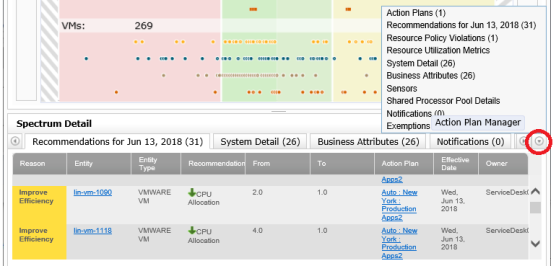
If you have created any action plans for this infrastructure group, they will be listed on this tab. Details of the planned changes, as well as the status and effective date are shown on the tab. Only those Action Plans that have an Effective Date that is greater than or equal to yesterday (the day before the Today date of the selected environment), are displayed here. The displayed action plan count includes only those action plans with an effective date greater than or equal to yesterday, as based on the Today date of the environment. You can view the Action Plan Manager from the Spectrum Details by clicking the Action Plan Manager button, located in the header of the Spectrum Detail pane. The Action Plan Manager launches with the selected environment displayed. |
|||
|
Recommendations for <selected day> |
H | V | S |
The action/recommendation framework provides details of actions that can be made to move systems from Too Little Infrastructure or Too Much Infrastructure to Just Right. Only recommendations pertaining to the selected host or VM systems are displayed. You can preview your environment with the proposed recommendations completed, using the Displayed with recommendations applied option at the top-right of the Control Console. |
||
|
Resource Policy Violations |
H | V |
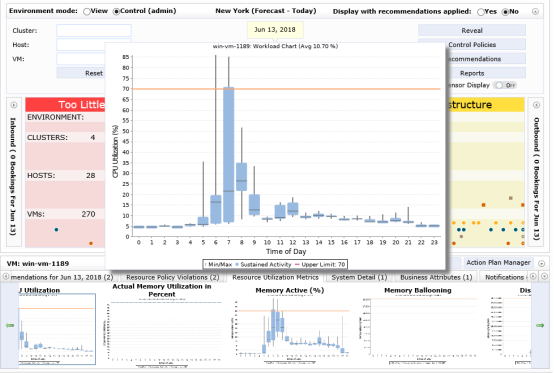
For the selected system, a chart is displayed for each resource utilization that is too high or low based on the policy settings. Each chart shows minimum/maximum values, sustained activity and the upper/lower limit as set by the corresponding policy. As you roll-over the chart, a larger view is displayed. Double-click the chart to launch the Workload Viewer for that system. This tab is only available when a single host or single VM is selected. Note that a resource utilization chart is not provided when the violation is caused by an aggressive reclaim (policy setting CPU/Memory/Disk - Reclaim Mode is set to "Aggressive"). |
|||
|
Resource Utilization Metrics |
G | H | V |
Resource utilization charts are displayed for the selected system. The charts show the aggregate workload if a VM is selected. See Resource Utilization Metrics Tab below for more details on the displayed workload charts. This tab is only available when a single infrastructure group, single host or single VM is selected. |
||
|
System Detail |
G | H | V |
This tab lists the available system details of the selected systems and any associated contained systems. i.e. if you selected an infrastructure group, you will see system details for each host contained in the infrastructure group as well as each VM on those hosts. If you selected a host, you will see system details for the host and each VM contained in that host. If you select a VM, then only the details of the selected VM are displayed. |
||
|
Business Attributes |
G | H | V |
This tab lists the specific system attributes and their values for the selected systems and any associated contained systems. i.e. if you selected an infrastructure group, you will see system details for each host contained in the infrastructure group as well as each VM on those hosts. |
||
|
Notifications |
E | G | H | V |
This tab shows the data validation details for all systems that have been excluded from the data collection due to missing benchmarks or if any systems are missing the amount of data required for an analysis. |
|
|
Exemptions |
E | G | H | V |
This tab lists any systems that have been granted an exemption, within the selected infrastructure group or host. |
|
|
<sensor type> |
S |
This tab lists all selected sensors and includes sensor metrics used to derive sensor scores (as well as the number of VMs and hosts associated to each sensor) depending on the sensor type:
Numbers are rounded to the 1 decimal point. Note: Sensors are displayed only when this data is available for the environment. |
||||
Resource Utilization Metrics Tab
This tab shows two sets of charts: those generated for both the high (red) and the low (yellow) limits.
The resource utilization metrics are displayed for both conditions, too much infrastructure and for too little infrastructure. This allows you to view all metrics and analyses for potential resource violations from the results of both the over-provisioned and the under-provisioned analyses.
A dividing line separates the over-provisioned and the under-provisioned charts. Use the right/left arrows to move forward and back through the displayed charts. As you roll-over the chart, a larger view is displayed. Double-click the chart to launch the Workload Viewer for that system.
If the selected system is in the red, then the under-provisioned (red zone) charts are shown first and over-provisioned (yellow zone) are shown after the divider. For the case where you have a VM in the yellow the spectrum is displayed like the following with low limit charts first since they resulted in the VM being placed in the yellow.