Clusters with Supply/Demand Mismatch Reports
Clusters with Supply/Demand Mismatch Reports
#120180
The Clusters with Supply/Demand Mismatch reports show how well the hardware resources (CPU, memory, disk, etc.) match the nature of the workload demand running in a cluster.
A high mismatch rating is an indication that:
- Supply is poorly matched—You need to adjust the hardware supply (e.g. add more resources based on the resource constraints).
- Demand is poorly matched—You need to adjust the workloads running on the cluster, by moving workloads between clusters (e.g. if a cluster is CPU constrained, move CPU intensive workloads out of this cluster).
The scope of these reports is defined by the global filter. See
Note: Values are reported based on the Average VM size, for the selected cluster, rather than on the standard VM size. Refer to the footer in the specific report, to view the Average VM Details report.
Understanding the Reports
The Clusters with Supply/Demand Mismatch report highlights how well the CPU, memory, storage, network I/O, etc. requirements of workloads match the containing clusters’ resources.
The Supply/Demand Mismatch report is comprised of three separate reports:
- Summary—This chart shows a summary of the clusters with a high mismatch and the possible density improvement that can be achieved if the resource constraints are addressed.
- Top Clusters—Lists the top 5 clusters with high mismatch.
- History—Graphs the 90-day history of the percentage of clusters with high mismatch ratings. Historical charts show all past environments, calculating counts and percentage of clusters at that time and plotting that result in the graph.
Zoom  to see a bar-chart view of the data at a cluster level. This chart provides a graphical view of the mismatch ratings. The tiles on the left provide the same summary as that provided by the high-level summary report.
Zoom to see the full list of clusters (with high mismatch clusters shown in yellow), plus the constraints used to determine the mismatch ratings.
Zoom to see the same graph, together with a graph showing the total number of clusters with high mismatch ratings. These graphs do not provide a breakdown by cluster.
High, Medium, Low Mismatch Ratings
The mismatch ratings go from high (i.e. poorly matched) to low (i.e. well matched):
- High—Addressing one or more resource constraints (e.g. adding storage) can more than double the total capacity of the cluster.
- Medium—Addressing one or more resource constraints can increase the total capacity by 50% or more.
- Low—The cluster’s resource supply and demand are well matched.
Viewing and Addressing Mismatched Guests
To view and address the mismatched workloads:
- Navigate to Virtual Optimization > Opportunity > Clusters with Supply/Demand Mismatch.
- View the clusters with a high mismatch by zooming from Top Clusters with High Mismatch. If there are multiple pages for the report, use the Next /Previous buttons to see all of the clusters within the selected scope.
- Review the resource constraint for each cluster. You want to first target clusters with a high Mismatch Rating and no available space. The cluster capacity constraints are grouped into four categories: CPU, Memory, Storage and Other. This last group, "Other" includes disk-related workload types and network I/O. Disk and network I/O resource constraints are considered in the mismatch rating only if they are active constraints.
- Review and evaluate your options. For the clusters shown above:
- Increase the supply—Compare the capacity numbers for each cluster and adjust rresource allocations when there is a large discrepancy.
- Change your workload distribution—You may want to consider moving workloads that are better suited for certain clusters. e.g. you can move CPU intensive workloads from clusters that are CPU constrained. Review the Clusters with Surplus Capacity report to determine where there may be excess capacity.
- Define your routing strategy—You may want to consider routing new workloads to certain clusters that are better suitable, than other clusters. e.g. route CPU intensive workloads to clusters that have more available CPU.
- Revisit policy settings—You may want to review your over-commit policy settings. Contact [email protected].
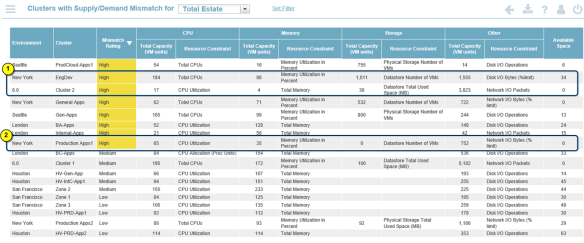
For example, in the first case above, assuming you are working with an optimized environment, you may consider increasing the amount of CPU and memory as the other capacity numbers are large enough to host many more VMs.
In the second case, consider increasing the memory and storage, as CPU and the capacity of the "Other" category can host many more VMs.
Table: Possible Resolutions for High Mismatch
|
Example Constraint |
Possible Resolution |
|
CPU |
|
|---|---|
|
Total CPUs |
|
|
CPU Utilization |
|
|
CPU Allocation |
|
|
Memory |
|
|
Memory Utilization in Percent |
|
|
Total Memory |
|
|
Storage |
|
|
Datastore Number of VMs |
|
|
Datastore Total Used Space (MB) |
|
|
Physical Storage Total Used Space (MB) |
|
|
Disk I/O Bytes (% limit) |
|
|
Other |
|
|
Network I/O Bytes (% limit) |
|
|
Network I/O Packets |
|