Clusters with Surplus Capacity Reports
Clusters with Surplus Capacity Reports
#120160
The Clusters With Surplus Capacity reports show the clusters (as defined by your global filter) with excess infrastructure, by showing the number of extra VMs that can be placed. Clusters are considered to have surplus capacity if the number of surplus VM capacity units is greater than 0.
Surplus capacity in a cluster, highlighted in yellow, can be reduced by:
- running more workloads,
- opening clusters that have been closed early or unnecessarily and then running more workloads,
- redeploying excess resources to other environments, or
- decommissioning excess resources.
Note: Capacity is calculated based on average VM size or standard VM size, depending on your settings. The footnote, shown only in the zoomed  reports, details the VM size used. See
Also, these reports provide details only for the scope defined by your global filter. See
Understanding Clusters With Surplus Capacity Reports
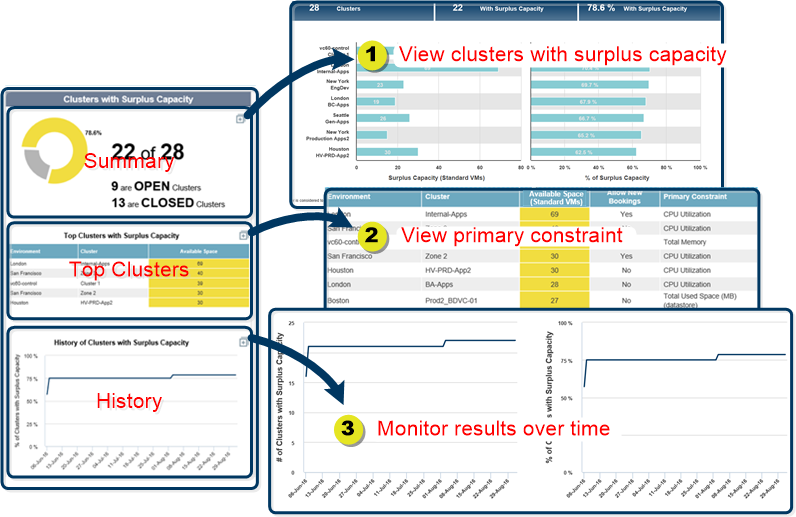
The Clusters with Surplus Capacity report is comprised of three separate reports, as explained by the figure below:
- Summary—A cluster is considered to have surplus capacity if the number of surplus VM capacity units is greater than 0. From the example, 22 out of the 28 clusters in scope have a surplus capacity. Out of the 22 clusters, 9 are open and 13 are closed.
- Top Clusters—Lists the top 5 clusters by the number of standard/average VM capacity units that can still fit according to policy.
- History—Graphs the 90-day history of the percentage of clusters with surplus capacity within the defined scope.
Zoom to see the clusters with surplus capacity, sorted in descending order by % of surplus capacity (which is the # of standard/average VM units in surplus divided by the total number of VMs in the cluster). The Oversized Guests report also shows the surplus capacity in terms of the number of standard/average VM capacity units that can still fit according to the defined policy.
Zoomto see the full list of all clusters showing the available capacity (in terms of the number of standard/average VM capacity units) and the primary constraint. This will be the primary constraint once the available capacity has been consumed.
Zoom to see the expanded view containing a graph showing the total number of clusters with surplus capacity for all clusters in scope, as well as the initial chart showing the percentage of clusters with surplus capacity. These graphs do not provide a breakdown by cluster.
You can hover the mouse over trace in either graph to see the values on the selected date.
Monitoring Clusters with Surplus Capacity
To view and address the clusters at risk:
- Navigate to Virtual Optimization > Opportunity > Clusters with Surplus Capacity.
- View the surplus clusters by zooming in from the summary report. This gives you an idea which clusters have the most surplus. During the initial ramp-up phase you may need to review your policy settings if the summary does not coincide with the performance of these clusters.
- View the primary constraint for each of these clusters by zooming from Top Clusters. The primary constraint is based on the operational policy settings. Surplus can be reduced by removing hosts, and adding them to clusters that are at risk (see
- View the History of Clusters with Surplus Capacity the next day to monitor the capacity, as necessary.