Clusters with Insufficient Capacity Reports
Clusters with Insufficient Capacity Reports
#120100
The Clusters With Insufficient Capacity reports show the clusters (as defined by your global filter) with insufficient capacity and could be at risk. Clusters with insufficient capacity are considered at risk when the available space is 0 or negative, which is determined by your policy settings. See
Risks can be reduced for clusters with insufficient capacity, highlighted in red, by:
- adding resources,
- moving workloads,
- when appropriate, modifying overly constrained policy settings.
Note: Capacity is calculated based on average VM size or standard VM size, depending on your settings. The footnote, shown only in the zoomed  reports, details the VM size used. See
Also, these reports provide details only for the scope defined by your global filter. See
Understanding Clusters With Insufficient Capacity Reports
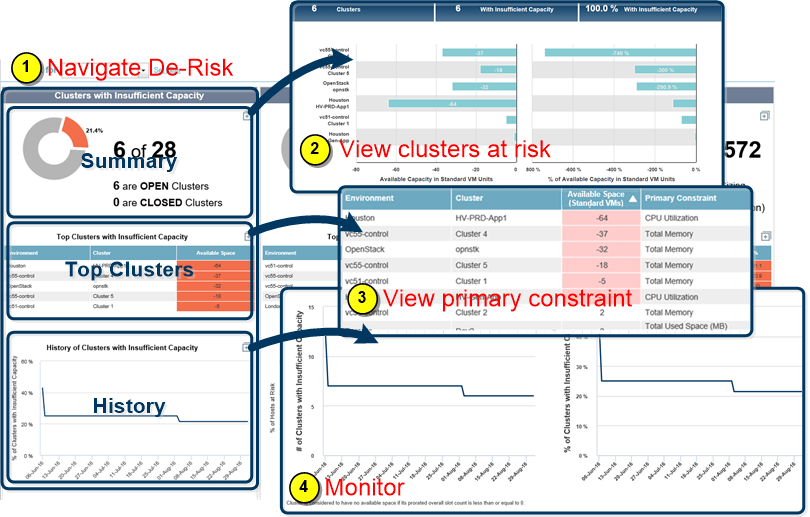
The Clusters With Insufficient Capacity report is comprised of three separate reports, as explained by the figure below:
- Summary—This report shows which clusters are at risk in the environment due to not having enough infrastructure to support the running workloads, based on the operational policy settings. From the example, 6 out of the 28 clusters in scope, as defined by the global filter, have insufficient capacity. Of the 6 clusters, all 6 are open (i.e. 0 are closed).
- Top Clusters—Lists the top 5 clusters by percentage that have insufficient capacity. Zoom to see the full list of all clusters (with or without risk) showing the available capacity (in terms of the number of standard/average VM capacity units) and the primary constraint.
- History—Graphs the 90-day history of the percentage of clusters with insufficient capacity across all clusters in scope. Zoom to see the same graph, together with a graph showing the total number of clusters with insufficient capacity for all clusters in the scope. These graphs do not provide a breakdown by cluster.
Zoom to see the clusters with insufficient capacity (zero or negative), graphed by the percentage of available capacity in terms of standard/average VM capacity units that are oversubscribed, resulting in a negative value. The expanded report also shows the available capacity in terms of the number of standard/average VM capacity units that are oversubscribed, according to policy. The standard/average VM capacity unit definition is also provided with this report.
Monitoring Clusters with Insufficient Capacity
To view and address the clusters at risk:
- Navigate to Virtual Optimization > Risk > Clusters with Insufficient Capacity.
- View the clusters at risk by zooming from the Summary. This gives you an idea which clusters have most risk and which have little risk. During the initial ramp-up phase you may need to review your policy settings if the summary does not coincide with the performance of these clusters.
- View the primary constraint for each of these clusters by zooming from Top Clusters. The primary resource constraint is based on the operational policy settings. Risks can be reduced by addressing rebalancing recommendations and adding more hosts. See Viewing and Addressing Hosts at Risk to perform rebalancing recommendations and
- View the History of Clusters with Insufficient Capacity the next day to monitor the capacity. You should expect to see the number of clusters that are at risk, decreasing over time, as resourcing recommendations are addressed. If you have continued unavailable capacity, you may want to add more supply. View the Required Hosts in the Control Console, as described in