Hosts at Risk Reports
Hosts at Risk Reports
#120130
The Hosts at Risk reports show the hosts (as defined by your global filter) that are at risk because they have too many workload placements according to operational policy.
Note: These reports provide details for the scope of systems defined by your global filter. See
Understanding Hosts at Risk Reports
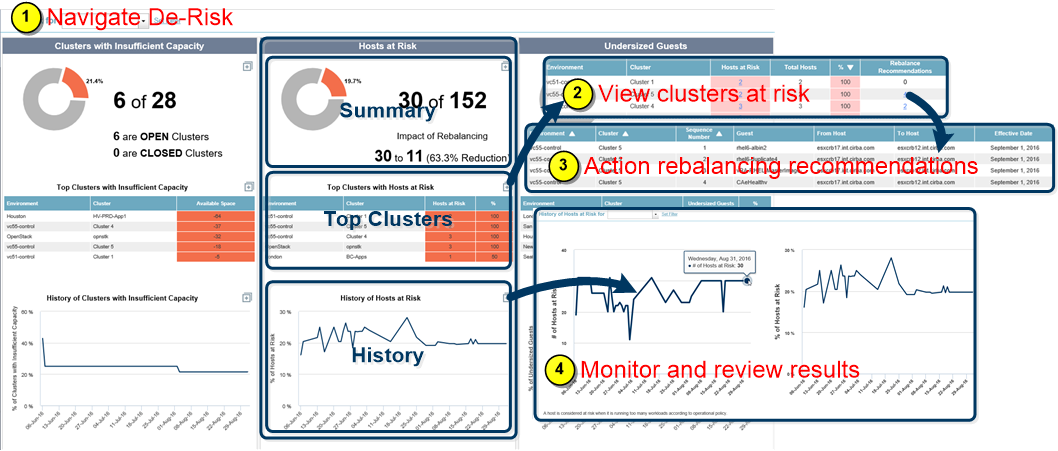
The Hosts at Risk report is comprised of three separate reports, as explained by the figure below:
- Summary—Shows the number of host servers at risk in the environment because to there are too many workload placements according to the operational policy. The number of hosts at risk can be reduced by implementing rebalancing the recommendations. In the following example, 30 out of the 152 hosts in scope contain hosts at risk. If the rebalancing recommendations are performed, you can reduce your risk from 30 hosts in the red to 11, which is a 63.3% reduction (i.e. 19/30).
- Top Clusters—Lists the top 5 clusters by percentage that have hosts at risk. This list contains the number of hosts at risk and the % of hosts at risk. If there are only 3 hosts in the cluster and all of them are at risk, then 100% of the hosts in that cluster are at risk.
- History—Graphs the 90-day history of the total percentage of hosts at risk.
Zoom  to see the full list of clusters with hosts at risk, ordered in descending order by % of Host Servers at Risk.
Zoom to see the full list of all clusters (with or without host risk), plus a link to obtain the list of host details (including configuration details and risk reasons) and the rebalancing recommendations for each cluster.
Zoom to see the same graph, together with a graph showing the total number of hosts at risk. These graphs do not provide a breakdown by cluster.
Viewing and Addressing Hosts at Risk
To view and address the hosts at risk:
- Navigate to Virtual Optimization > Risk > Hosts at Risk.
- View the clusters with risk by zooming from Top Clusters with Hosts at Risk. The clusters are sorted so that the greatest % of hosts at risk appear at the top.
- For each of these clusters with hosts at risk (shown in red), click on the Rebalance Recommendations to review the recommendations. If you are executing these recommendations manually, start with the clusters having the highest risk. Clusters can be de-risked by moving workloads from the at-risk hosts to other hosts. Execute these recommendations in the sequence provided, by applying your customer-specific scripted solution.
- View the History of Hosts at Risk the next day to see the impact of these rebalancing moves. If you apply these recommendations regularly, you can use the History of Hosts at Risk to monitor continued progress.
You can now review the Undersized Guests Reports, to see specific allocation bump ups that can also alleviate risk.