Optimizing Your Containers - ECS Details Tab
Optimizing Your Containers - ECS Details Tab
#380810
The ECS Container Optimization Details report displays detailed information for the selected container (row) by clicking on any of the zone description hyperlinks on the Analysis tab.
Note: Containers that do not have adequate information for recommendation analysis are not included on the Details tab.
Page Navigation
Click the Back ( ) button, in the top-right corner of the page, to return to the parent dashboard. Do not use the browser's Back button for navigation within Densify. You will be logged out of your session. See
This dashboard consists of:
- A tabular report—The columns of the tabular report are listed in the Table: ECS Optimization Details Tabular Report below.
- Resource Utilization Charts—Based on the container selected in the top pane, the lower pane shows the corresponding resource utilization charts.
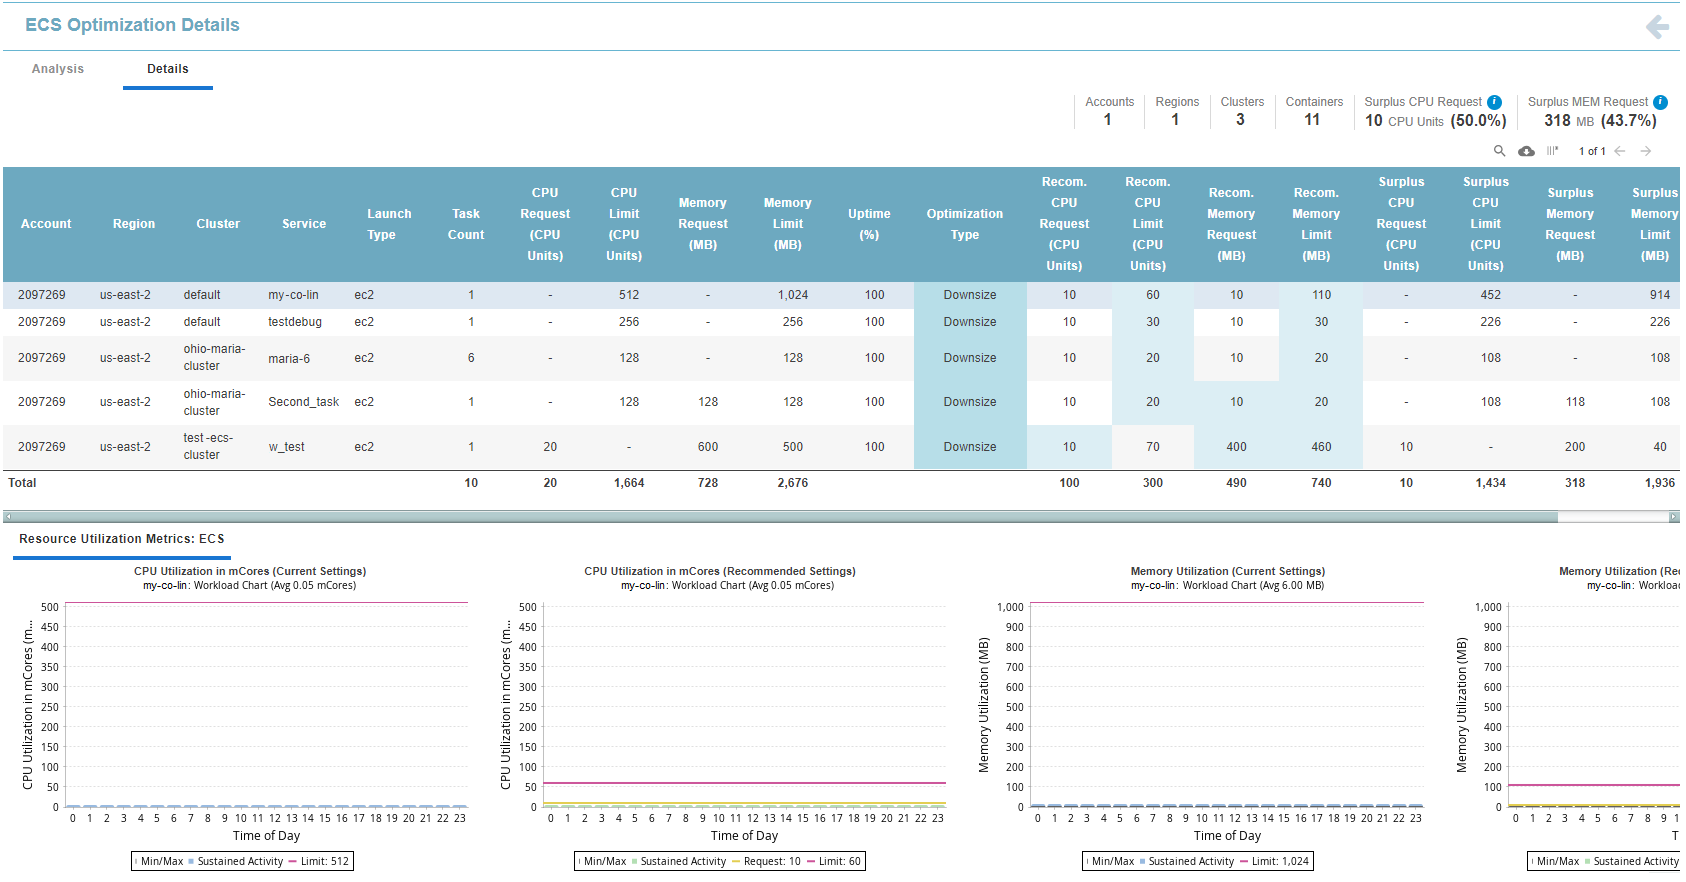
Running totals are displayed in the upper right corner of the page. These values indicate what is included in the displayed histograms include the number of Accounts, Regions, Cluster and Containers.
The total number of containers is calculated as Number of Tasks * Number of Containers defined in each task.
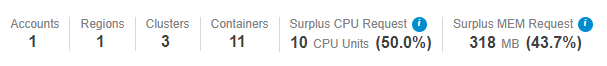
The information icon, on the Surplus CPU Request/Surplus Memory Request values indicates that these values do not include containers with requests set to "Unspecified". In this case, 'unspecified" means there are no request or limit values specified in the task definition for CPU and/or memory.
Since these containers ("Unspecified") are sized based on resource availability, it is not meaningful to compare them to containers that do have defined request and/or limit settings.
If you have created and applied filters, the totals, displayed in this summary, reflect the defined filters. This bar is not displayed if no data is available due to filter settings or lack of collected data.
You can use the following options for managing and viewing your data more effectively.


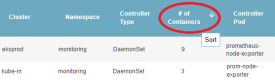
By default the table is sorted by cluster name. You can sort the content of this table using any of the available columns, by clicking the column header.
- Click the column header to sort the table, in ascending order, using the content of the selected table as the sort key.
- Click the column header again, to sort the table, in descending order, again using the content of the selected column as the sort key.
- Click the column header a third time to clear the sort and return to the default, sorted by Cluster.
An up/down arrow is displayed in the column header to indicate the column is being used to sort the content of the table.
Sorting is not persistent between pages, tabs or login sessions.
When the page is initially loaded, this table is sorted alphabetically, by Account and Region.
The content of the table as well as the totals at the bottom reflect the filter settings in Summary or Analysis tabs.
Table: ECS Optimization Details Tabular Report
|
Component/Column Name |
Description |
|---|---|
|
Account |
The AWS account containing the ECS service. |
|
Region |
The region hosting the ECS infrastructure. |
|
Cluster |
The name of the cluster associated with the ECS service. |
|
Service |
This is the name of the ECS service. |
|
Launch Type |
This is the launch type associated with the ECS service. This can be one of EC2 or Fargate. |
|
Task Count |
The number of tasks running in the ECS service. |
|
CPU Request(CPU Units) CPU Limit Memory Request (MB) Memory Limit (MB) |
The current request and limit CPU | memory values for the selected service are shown in these columns. The total, listed at the bottom of the Request and Limit columns for both CPU and memory, is calculated as (Current CPU Request * Current Count). This formula is also used for CPU Limit and Memory Limit. For containers where the Current CPU value is unspecified a dash (-) is displayed in the main table and '0' is displayed in the "Total" row. |
|
Uptime % |
Uptime % is the total time the container has been running as a percentage of the total hours since the container was deployed. (Running Hrs/Total Hrs). When using pay-per-use pricing models, the amount of time each instance has been running, is required to accurately estimate future costs. The predicted uptime (%) for an instance or container, is based on the percentage of hours CPU utilization data is present in the historical interval, as specified in the policy settings for the ASG. Individual child instances are not taken into account. Predicted uptime %, for new instances or containers, that started mid-way through the historical interval, is calculated from the time/date that the instance was started as opposed to the beginning of the interval, resulting in more accurate predictions for future usage. For example, the uptime is the number of hours that have "CPU Utilization in mcores", and the range is the lesser of when the container was discovered, or the range defined in the policy. Looking at a specific container that was discovered on Jan 5th 2023, that has workload of 42 hours since that date, then the uptime % is 42 hrs/(13 days x 24 hrs/day) = 13.4%. This is the value is shown in this column. |
|
Total Hrs |
The total hours are determined by calculating the duration from the time the first container, as defined by the service, starts, until the point that Densify analyzes the specified containers. Total hours continues to increment until the service is no longer discovered by Densify. This column is hidden by default. You can enable it for display, as required. See Data Controls, above. |
|
Running Hrs |
Running hours is the number of hours of CPU utilization data from any running containers, as defined by the service. The number of running containers is not used when determining the number of running hours. i.e. if 3 containers are running from 2pm to 6pm, then “Running Hours” will be 4 hrs. This column is hidden by default. You can enable it for display, as required. See Data Controls, above. |
|
Optimization Type |
Identifies the overall result of the optimization analysis. This is the recommendation. Values are colour-coded and the possible options are listed in ECS Service Optimization Types, below. |
|
Recom. CPU Request(CPU Units) Recom. CPU Limit(CPU Units) Recom. Memory Request (MB) Recom. Memory Limit(MB) |
The recommended request and limit CPU | memory values for the selected service are shown in these columns. The total, listed at the bottom of the Request and Limit columns for both CPU and Memory, is calculated as (Recommended CPU Request * Recommended Count). This formula is also used for CPU Limit and Memory Limit. Recommendations for ECS services that are hosted on Fargate infrastructure will be based on the available pre-defined task sizes that specify both CPU and memory allocations. The pre-defined Fargate task sizes are included with the AWS metadata and are updated with each Densify release. Fargate recommendation type resolution is based on limit values only, since limits dictate the cost, whereas the requests are optional and are only used when dividing resources between containers within the task. Not all Fargate sizes are supported for Windows-based services. This may also impact recommended sizing. See Working with Fargate Instances, below. Refer to the AWS documentation for details of the pre-defined Fargate sizes. |
|
Surplus CPU Request (CPU Units) Surplus CPU Limit (CPU Units) Surplus Memory Request (MB) Surplus Memory Limit (MB) |
The surplus request and limit CPU | memory values for the selected service are shown in these columns. The surplus is the difference between the current and the recommended values. If the current value is unspecified, then the surplus value will be negative (i.e. 0 minus recommended value). The value can also be negative if there is resource shortfall and CPU or memory need to be increased. The total, listed at the bottom of the Surplus columns for both CPU and Memory, is calculated as (Current - Recommended). |
|
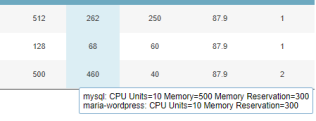
Containers per Task |
This is the number of containers that are defined by the task description. You can hover over the cell to see the container name and its current CPU and memory allocation. |
|
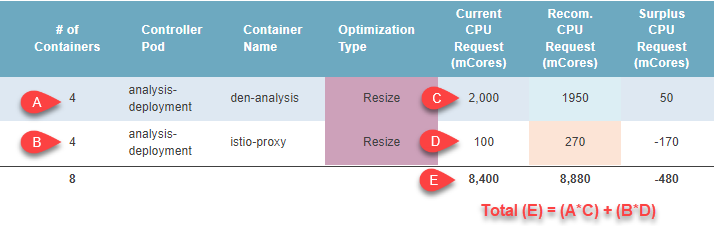
Shown in bold at the bottom of the table, the totals for each column for all the records on the selected page of the filtered tabular report. The total, listed at the bottom of the Request and Limit columns for both CPU and Memory, is calculated as (Current CPU Request * # of Containers). This formula is also used for CPU Limit, Memory Request and Memory Limit. The total, listed at the bottom of the Surplus columns for both CPU and Memory, is calculated as: (Current - Recommended). If the value of any row is unspecified, then that value is treated as "0" when summing the values for the total. If there are multiple pages of data, the totals are the "subtotals" for the selected page only and not an aggregate of all analyzed ECS services. |
ECS Service Optimization Types
Densify ECS recommendations are categorized into optimization types, which are based on recommended sizing for the CPU Request, CPU Limit, Memory Request, and Memory Limit settings. See the table below for a description of each optimization type.
Table: Container Optimization Type Summary
|
Optimization Type |
Description |
|---|---|
|
Just Right |
This container manifest or task definition is optimally configured for the workload. There are no resizing recommendations. |
|
Upsize |
Densify recommends increasing one or more of CPU Request, CPU Limit, Memory Request, or Memory Limit settings. An "Upsize" optimization type has no recommendations to decrease any container CPU or memory request or limit settings. For example, Densify assigns an "Upsize" optimization type if a container manifest or task definition has the following aggregate optimization recommendations:
|
|
Downsize |
Densify recommends decreasing one or more of CPU Request, CPU Limit, Memory Request, or Memory Limit settings. A "Downsize" optimization type does not have any size increase recommendations for any request or limit settings. For example, Densify assigns a "Downsize" optimization types for the following aggregate recommendations:
|
|
Resize |
Densify recommends resizing at least two of CPU Request, CPU Limit, Memory Request, or Memory Limit settings. For the "Resize" optimization type, there is at least one increase recommendation and at least one decrease recommendation. For example, Densify assigns a "Resize" optimization type if a container has the following recommendations:
|
|
Size from Unspecified |
Sizing recommendations are made without current CPU Request, CPU Limit, Memory Request, and Memory Limit values. For "Size from Unspecified" optimization type, there is at least one sizing recommendation from an unspecified setting and no decreasing or increasing size recommendations for any container request or limit settings. For example, Densify assigns a "Size from Unspecified" optimization type if a container has the following recommendations:
|
|
No Data |
There is insufficient data to recommend changes to CPU Request, CPU Limit, Memory Request, or Memory Limit values. |
Working with Fargate Instances
When working with Fargate instances Densify uses a list of pre-defined Fargate task sizes. In some cases an upsize recommendation results in no changes due to the fact that the Densify-recommended sizing is not available in the pre-defined Fargate task size list.
In this case, based on the workload Densify recommends using the largest Fargate task size that is provided in the pre-defined Fargate catalog. If that task size is the one that is currently in use then no other changes are recommended and you will see a note indicating, "Recommended allocation was capped due to maximum allowed value." This note is indicated in the Host Attributes dashboard, accessible through the Analysis Console. Contact [email protected] for details.
Densify only caps the "Recommended CPU Limit" and the "Recommended Memory Limit" and indicates this in the Host Attributes dashboard. Values for "Recommended CPU Request" and "Recommended Memory Request" are not capped.
Reviewing the Resource Utilization Metrics Charts
Clicking on any row in the tabular report, in the upper pane, shows the Resource Utilization Metrics tab, in the lower pane. The workload charts on this tab show the current and the recommended settings:
|
|
If you are using different metrics for CPU and memory requests and limits, the selected metric will be listed in the title of the chart.
If the optimization type is "Just Right", then only CPU and memory current utilization charts are displayed.
Note: If no metrics are available, then the corresponding charts are not displayed.
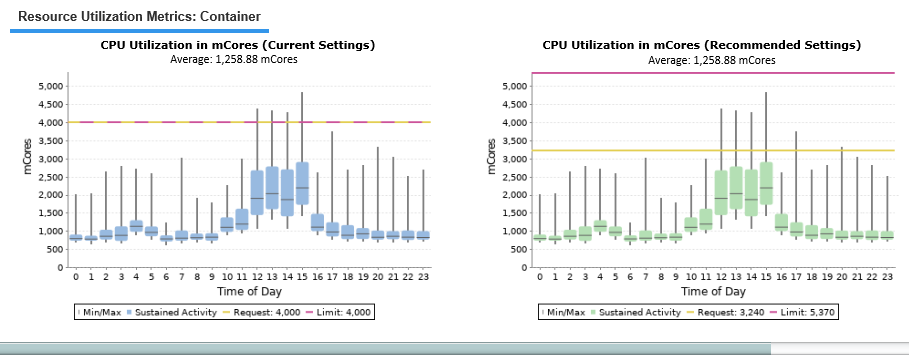
The CPU and memory current utilization charts show hourly min/max and sustained activity for the selected service. If necessary use the left/right arrows to scroll though the workload charts.
Workload charts display current sustained activity in blue, while sustained activity on the recommended request settings chart is shown in green.
The minimum and maximum utilization values are shown as vertical lines above and below the coloured block. The median is indicated as a black line within the coloured block. The average is indicated in brackets in the subtitle of the chart.
The Y-axis is scaled dynamically to match the range of data. The yellow line, indicating the request setting, is shown and the setting of the Y-axis scale also accounts for the request setting. The pink line indicates the limit. If the request and the limit are the same, the dashed yellow/pink line indicates that value. The units of the workload are also shown on the Y-axis.
Use the scroll bar, located below the charts to the view the other charts.
Understanding the Quartiles in the CPU and Memory Utilization Charts
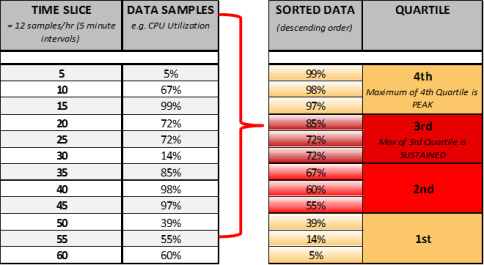
In charts, workload data for each system is shown in four different bars (two yellow and two red), called quartiles, to show minimum, average, sustained and peak values. When used in the analysis, quartiles provide a good representation of system activity because the weighted scoring for sustained and peak activity produces a more accurate assessment of workload utilization patterns and requirements.
Quartiles are calculated in the following manner:
- Workload activity is collected every five minutes, which totals 12 times per hour.
- The 12 values are then re-ordered in descending order and separated into equal sample sizes (quartiles), with each quartile having three values. Each quartile represents 25% of operational time.
- The bottom of the first quartile shows the minimum value, the next quartile shows average values, the top of the third quartile shows the sustained value and the top of the fourth quartile shows the peak value.
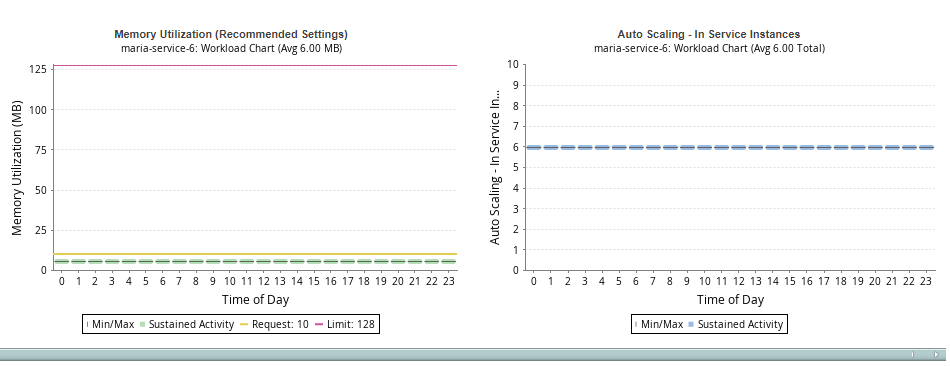
Understanding the ASG - In Service Instances Charts
Use the scroll bar, located below the charts to view the ASG chart.
The last chart in this group shows the average number of ASG instances per hour that were used to run the selected ECS service.