DCE Info Tab
DCE Info Tab
#171160
This tab provides general, technical, business, and workload information for either a selected folder or a single system. The folder can be at the platform, domain, datacenter, cluster or host level.
Note: Some features are only available for single systems and are not displayed in the toolbar when a folder is selected; while other features are for a folder and not available for a single selected system.
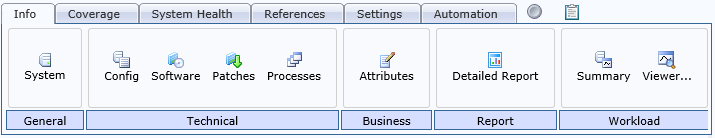
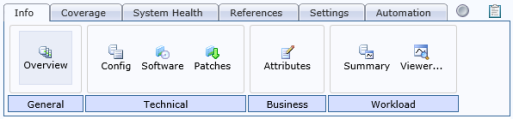
Table: Info Tab Toolbar Buttons
|
Button |
Description |
|
General |
|
|
|
Folder level dashboard only. This feature is not available when a single system is selected. This dashboard is displayed by default, showing a summary of what is contained within the selected folder. You can drill-down on the hyperlink values, in the table, to access the details of the systems. |
|
|
System dashboard only. This feature is not available when a folder is selected. This dashboard is displayed by default, showing a summary of the selected system, such as the system name, system location, manufacturer, OS, etc. |
|
|
Click this button to display the System Reporting functionality. Detailed system information collected from the audit is displayed. |
|
Technical |
|
|
|
This feature shows different views of the configuration information depending on whether you have selected a folder or single system. Folder—Click this button to display aggregated configuration information about the systems contained within the selected folder, such as (platform, hardware, OS, etc). You can drill-down on the hyperlink values to see detailed system information. System—Click this button to display configuration information about the selected system, such as OS information, hardware information, processor information, memory and networking information. |
|
|
This feature shows different views of the information depending on whether you have selected a folder or single system. Folder—Click this button to display aggregated information about software installed on all systems within the selected folder. The table displays the software name, the version, the systems on which it is installed, and the systems on which it is not installed. You can drill-down on the hyperlink values to see detailed system information. System—Click this button to display information about software installed on the selected system, such as the software name, version, and installation date. |
|
|
Folder—Click this button to display information about patches installed on systems in the selected folder. The table displays the patch name, the patch level, the systems on which the patch is installed, and the systems on which the patch is not installed. You can drill-down on the hyperlink values. System—Click this button to display information about patches installed on the selected system, such as the patch name and the patch level. |
|
|
System dashboard only. This feature is not available when a folder is selected. Click this button to display information about processes running on the selected system, such as the Process ID (PID), the process name, the executable command, the virtual size, the process time, and percent CPU. |
|
Business |
|
|
|
Click this button to display information about all system attributes associated with systems. You can also edit attributes from this location. |
|
Report |
|
|
Detailed Report |
System dashboard only. This feature is not available when a folder is selected. Click this button to display a report of the last audit. The detailed report contains audit information section at the top and a module table that is a hyperlinked table of contents. Click one of the links to jump to a specific section of the report. The specific content of the report varies depending on the type of system selected. |
|
Workload |
|
|
|
Click this button to display a summary workload chart for the selected systems from the most recent day of data. This viewer considers systems having 1 hour or more of data collected. You can drill-down on the information by clicking the hyperlink names (i.e. Most Recent Day, Current Month, Previous Month). You can also change the workload type, from the Workload Type dropdown. Hover your cursor over a particular column for a summary of information about that column. If the You can click on the Information is also displayed in a table beneath the chart. |
|
|
Click this button to view the workload over a range of dates. This viewer only considers selected systems that have at least 24 hours of data. This can be changed in Default Options as necessary. If you change the Default Options by enabling and setting the Last 1 days with available data and Includes days with 1 or more hour(s) data, then the viewer is the same as that provided by the Most Recent Day of the Summary workload viewer above. From the viewer, you can also view historical workload patterns and trends. Other views of the same data can be obtained using workload charts. See DCE Workload Charts and DCE Workload Data. |
|
|
Click this button to access the workload extract functionality. This allows you to view raw workload data, export it to a .CSV file and then use it for chargeback purposes. . |


 icon is displayed, when you hover over a column, you can drill-down on that column.
  icon to refresh the workload summary with the most up-to-date workload data.
