Container Data Collection Using Azure Managed Service for Prometheus
Container Data Collection Using Azure Managed Service for Prometheus
#410270
You can use the Azure Managed Service for Prometheus (AzMP) for container data collection. Data collection can be configured in 2 ways:
- Prometheus-Enabled AKS Cluster—This method is recommended for ease of setup. You can enable metrics collection from your AKS clusters and send the data to your Azure Monitor Prometheus workspace.
- Remote-write from Self-Managed Prometheus—This method allows you to configure your own Prometheus stack and use its remote-write protocol to send collected data an Azure Monitor Workspace. See remote-write protocol to an Azure Monitor Workspace for configuration details.
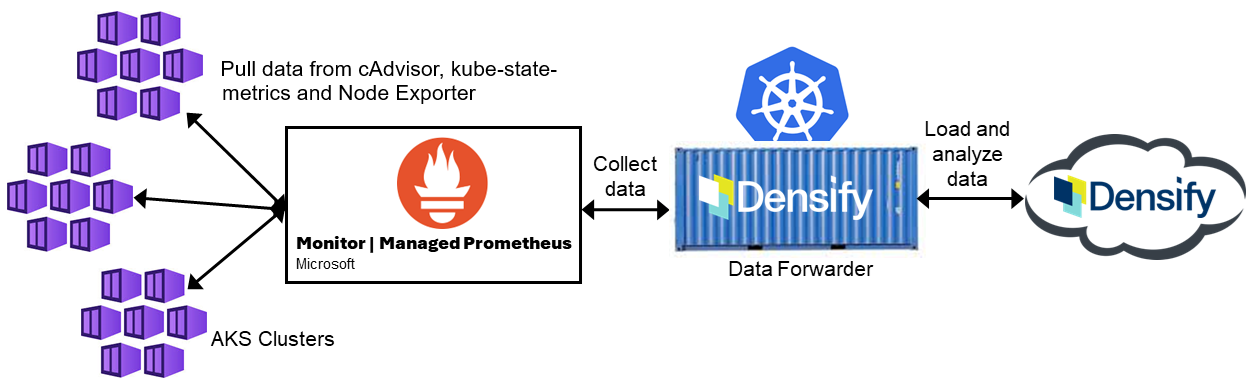
One limitation is that the default AKS monitoring stack does not collect all of the metrics required by Densify for its analysis. A script, setup-azmp-aks-cluster.sh is provided to address this issue.
Additionally, you need to configure an Azure service principal and give it the required permissions to access to run PromQL queries against the AzMP API. Another script, register-app-create-secret.sh to automate this process.
You must also follow the general instructions to deploy the your exporter. Ensure that all of the metrics, required by Densify, are being collected. See Required Prometheus Metrics.
Before you begin, ensure you meet all of the prerequisite software and configuration requirements. See Container Data Collection Prerequisites.
Navigate to https://github.com/densify-dev/container-data-collection/tree/main/multi-cluster/examples/azmp for instructions.
Configuring the Data Forwarder Using configmap.yaml
Use the configmap.yaml to provide connectivity details for Densify, Prometheus and identity details for all of the clusters to be analyzed. If necessary, refe to the table below, for details of the required settings.
Table: Data Forwarder Settings in config.yaml
|
Term |
Description |
Value |
||
|
Forwarder Configuration |
||||
|
scheme |
Specify the protocol to be used to connect to the Densify REST API interface. Select http or https. |
https |
||
|
host |
Specify your Densifyinstance details (e.g. myCompany.densify.com). You may need to specify Densify IP address. |
<host> |
||
|
port |
Specify the TCP/IP port used to connect to the Densify server. You should not need to change this port number. |
443 |
||
|
username |
Specify the Densify user account that the Data Forwarder will use. This user must already exist in your Densify instance and have API access privileges. Contact [email protected] for the Densify user and epassword required to connect to your Densify instance. This user will be authenticated by the Densify server. |
<user name> |
||
|
password |
Specify the password associated with the user indicated above. Specify the password in plain text. |
|
||
|
encrypted_password |
Specify encrypted password for the user indicated above. The password must be encryptedand supersedes any value that has been specified in the password field, above. Typically, [email protected] will provide a Densify username and corresponding encrypted password when they setup your Densify instance container data collection. Ensure that only one of the password options is enabled (i.e. uncommented). |
<encrypted password> |
||
|
endpoint |
This is the connection endpoint for the API. You can leave the default value. |
/api/v2/r |
||
|
retry |
The retry settings are optional and if not set specifically, then the default values are used. See Configuring Retry Connection Attempts for setting details. |
|||
|
proxy |
If you need to configure data collection through a proxy server, see Configuring a Proxy Host. |
|||
|
prefix |
Specify a prefix for the compressed filename. Use the cluster name or the Prometheus server name or another name to identify the cluster data. The prefix will be prepended to the transferred filenames. |
<zip file prefix> |
||
|
Prometheus Configuration |
||||
|
scheme |
Specify the protocol to be used to connect to the Prometheus interface. Select http or https. |
https |
||
|
host |
Specify the Prometheus hostname. The host details are available at the "Query Endpoint" in the Azure Monitor Workspace page on your Azure Portal. The host will be in format: <AzMP workspace>.<Azure region>.prometheus.monitor.azure.com. |
<Prometheus hostname> |
||
|
port |
Specify your Prometheus service connection port. The default port is 9090. Ensure that this port is the web port associated with the Prometheus service name specified in prometheus_address. |
9090 |
||
|
username |
Not used for this configuration. |
<username> |
||
|
password |
Not used for this configuration. |
<password> |
||
|
bearer_token |
This setting is configured with a fixed name. Do not change the value entered here. |
<path> |
||
|
ca_cert |
Not used for this configuration. |
|
||
|
sigv4 |
This is not an option for AzMP. |
|
||
|
retry |
The retry settings are optional and if not set specifically, then the default values are used. See Configuring Retry Connection Attempts for setting details. |
|
||
|
Collection Settings |
||||
|
Indicate which entity types for which data should be collected. This section is optional and if not set or empty then all of the following entity types are included.
|
true |
|||
|
interval |
Optional: Specify the interval at which to collect data. Select one of days, hours or minutes. If you make changes here these interval settings must correspond with cronjob settings. |
minutes |
||
|
interval_size |
Optional: Specify the interval at which data is to be collected. If the interval is set to hours and interval_size is set to 1, then data is collected every hour. These interval settings need to correspond with your cronjob settings. |
1 |
||
|
history |
Optional: |
0 |
||
|
offset |
Optional: Specify the number of days, hours or minutes (based on the interval value) to offset data collection, backwards in time. |
0 |
||
|
sample_rate |
Optional: Specify the rate at which to collect samples within the specified interval. i.e. if the interval_size is set to 1 hour and sample rate is 5 seconds, then every hour 12 samples are collected. |
5 |
||
|
node_group_list |
Optional: Specify a nodegroup label reference. By default, the "node_group_list" parameter is commented out and the data forwarder use the values, listed:
If you want to specify a node group label that is not included in the following list, uncomment this parameter and specify your node group label. See Configuring Node Group Collection for more details. |
|
||
|
name |
In a multi-cluster configuration, each cluster must have a unique name as well as a set of unique identifiers for each cluster. |
<name of first cluster> |
||
|
identifiers |
Specify identifiers as a map of Prometheus labels (name and value) to uniquely identify the cluster. If you omit the identifiers, only one cluster can be present in this list. |
<label name>: <label value> |
||
|
Other |
||||
|
debug |
Use this setting to turn debugging on/off. |
<false> |
||