Stacking Ratio Optimization Reports
Stacking Ratio Optimization Reports
#120010
The Stacking Ratio Optimization (VMs per Host) reports show the opportunity to increase VM density in virtualized environments. The report shows the number of physical servers required to host your virtual machines and whether there is a surplus or shortfall, along with the current VM/server stacking ratio versus optimized ratios.
A cluster's stacking ratio can be improved by:
- running more workloads when there is surplus capacity
- reducing the amount of reclaimable capacity
- redeploying excess resources to other environments, or
- decommissioning excess resources
The scope of systems included in the these reports is defined by the global filter. See
Note: Values are reported based on the Average VM size, for the selected cluster, rather than on the standard VM size. Refer to the footer in the specific report, to view the Average VM Details report.
Understanding the Reports
The current stacking ratio is calculated by dividing the number of running VMs by the number of servers hosting these VMs.
The optimized stacking ratio is based on the
- Summary—Shows the overall current, optimized and potential improvement in stacking ratio.
- Top Clusters—Shows the 5 clusters with highest potential for improvement.
- History—Shows an historical view of the stacking ratio over time.
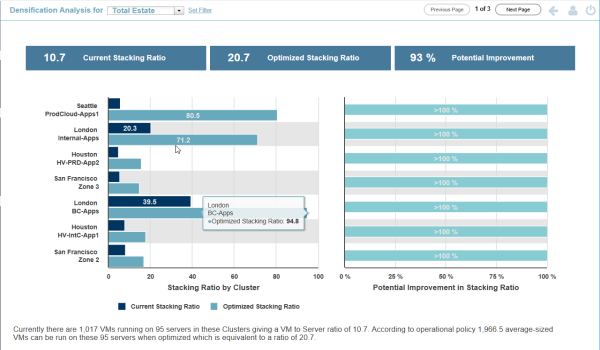
Zoom  to see the details on a per cluster basis. The first chart shows the current and optimized stacking ratios per cluster. The second chart shows potential improvement, i.e. the percentage change between the current and optimized stacking ratios (e.g. 20.7 / 10.7 - 1 = 93%).
The footnote summarizes the stacking ratio calculations.
Zoom to see the full version of the tabular report. Detailed breakdown of the number of VMs (both current and optimized), the stacking ratios (both current and optimized) and the percentage improvement. The optimized stacking ratio is based on the average VM size for the cluster.
Zoom to see the full version of the chart. The chart shows both the current and optimized stacking ratio over time. This chart shows that, as VMs are created or right-sized, the current density approaches the optimized density. Trends can be easily seen on the 90-day historical view.
In a new environment, without 90 days of historical data, you will see whatever data has been collected, to date. In an environment with more than 90 days of historical data, only the last 90 days will be displayed.