Oversized Guests Reports
Oversized Guests Reports
#120140
The Oversized Guests reports show the guests (as defined by your global filter) that are oversized (i.e. have excess infrastructure). Guests are considered oversized when they have been allocated too much CPU, memory or aggregate disk space according to the operational policy settings. If any one of these resources is in excess, the guest is considered oversized.
Only on-premise guests are reported (i.e. those with control analytics).
Note: These reports provide details for the scope of systems defined by your global filter. See
Understanding Oversized Guests Reports
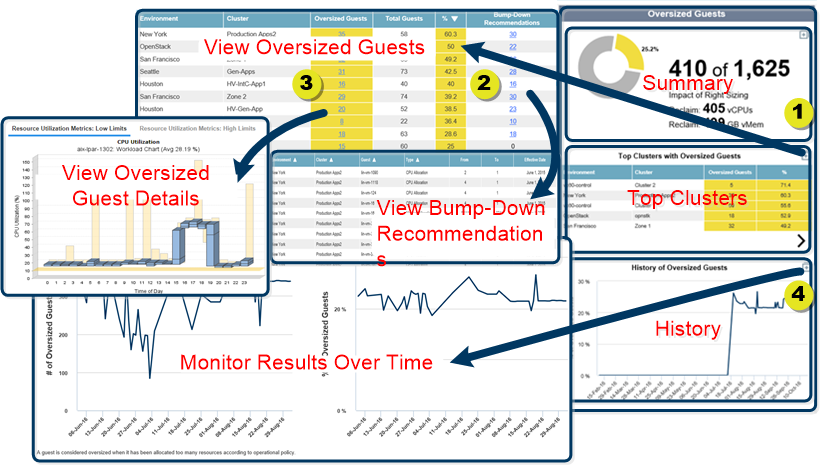
The Oversized Guests report is comprised of three separate reports, as explained by the figure below:
- Summary—Summarizes the number of guests within the defined scope that are oversized and how many resources can be reclaimed. Zoom
 to see this information as bar charts comparing clusters with oversized guests. The first charts shows the total number of oversized guests. The second chart shows these values as a percentage, displayed in descending order.
 - Top Clusters—Lists the top 5 clusters by percentage that have oversized guests. This list contains the number of oversized guests and the % of oversized guests. Zoom to see the full list of clusters (with or without oversized guests), plus links to oversized guest details (with oversized reasons and bump down recommendations in yellow) and links to the recommendations details and workload charts for each cluster.
- History—Graphs the 90-day history of the total % of oversized guests for all guests in scope. Zoom to see the same graph, together with a graph showing the total number of oversized guests for all guests in scope. These graphs do not provide a breakdown by cluster.
Viewing and Addressing Oversized Guests
To view and address the oversized guests at risk:
- Navigate to Private Cloud > Virtual Environments > Opportunity > Oversized Guests.
- View the clusters with oversized guests by zooming from Top Clusters with Oversized Guests.
- View the History of Oversized Guests each day to see the impact of the bump-down recommendations. If you apply these recommendations regularly, you can use the History of Oversized Guests to monitor continued progress over time.
Table: Clusters with Oversized Guests Report
|
Column |
Description |
|---|---|
|
Environment\Cluster |
This column shows the name of the environment and cluster containing the oversized guests. This table is sorted so that the highest percentage of oversized guests appear at the top. |
|
Oversized Guests |
This column shows the number of oversized guests, displayed as links. Click the link, to display the Guest Details report that shows each guest's details as well as the reason, as to why each listed guest is not sized efficiently. When you select a system in the Details report, utilization metrics, if available, are displayed on the Resource Utilization Metrics High/Low Limits tabs. Use the left/right arrows to scroll though the various workload charts. If no data has been collected or is not available, the corresponding chart is not displayed. Workload charts display current sustained activity in blue, while sustained activity on the recommended instance type chart is shown in green. The minimum and maximum utilization values are shown as vertical lines above and below the coloured block. The median is indicated as a black line within the coloured block. The average is indicated in brackets, in the sub-title of the chart. The scale used on the Y-axis is scaled dynamically to match the range of data. The pink line indicating the high policy limit setting is shown, and the setting of the Y-axis scale also accounts for this value. The yellow line indicates the policy low limit. If the high and low are the same, the dashed yellow/pink line indicates the value. Click on the System Details tab to see allocated resources and the relevant attributes that have been set for this guest. For more information about the Guest Details report for each cluster, see |
|
Total Guests |
This column shows the total number of analyzed guests. Values marked with an asterisk (*) indicate some of these guests are considered both undersized and oversized. This is the case if a system does not have enough allocated CPUs and has excess memory, for example. A footnote indicates the number of systems that are in this category and are thus counted twice, as oversized and undersized. |
|
% |
This is the percentage of guests that are oversized within the specified cluster. |
|
Bump-Down Recommendations |
This column shows the total number of bump down recommendations. Any value greater than 0 is displayed as a link. Click the hyperlink to view the Bump Down Recommendations report. For bump down recommendations, only the aggregate disk recommendations are reported. Per disk recommendations are not reported. If you are executing these recommendations manually, apply your customer-specific scripted solution or third-party tool. You can execute these recommendations through Action Automation. Contact [email protected] for details. You can export the content of the Clusters with Oversized Guests report or the Bump Down Recommendations report. |