Using Proactive Automation
Using Proactive Automation
#380240
With Proactive Automation, you can manage the CPU, memory and disk allocation changes separately.
Review the prerequisites before beginning Proactive Automation. See Action Automation Overview.
When proactive automation is enabled, Densify executes the following steps to generate recommendations and then executes these recommendations on your vCenter Server. Throughout this process the connector only pulls data from Densify. No data is ever pushed to your vCenter.
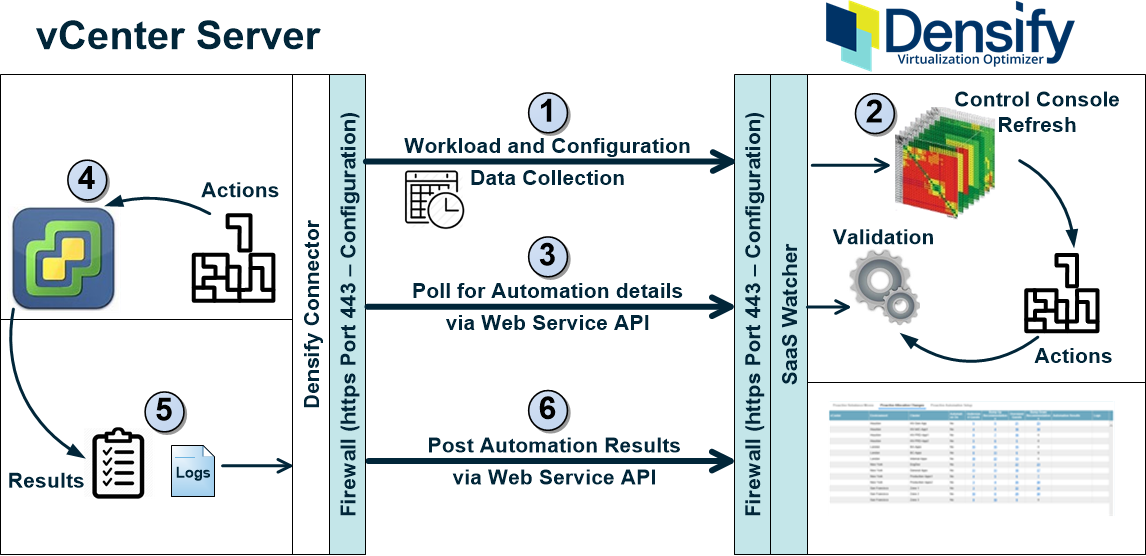
- Scheduled data collection occurs through the Densify Connector, which is installed locally on your vCenter Server. The connector uploads the repository to your dedicatedDensify instance.
- Once collected data has been transferred to your Densify instance and loaded into the database, the Control Console analyses are run. If a Control Console exists for the data, then the existing analytics are refreshed. If this a new environment, then the Control Console is automatically created and refreshed.
- The Densify Connector polls your Densify instance for automation instructions. All communication is through a RESTful Web Service API call directly to Densify, using HTTPS and is encrypted.
- Densify Connector, via a PowerShell script connects to the vCenter Server and using standard VMware CLI calls, applies the recommendations. The required credentials are encrypted and are stored locally by the Densify Connector.
- Results, including details of each attempt to apply a recommendation, as well as detailed logging information that can be used for troubleshooting, are generated after each action automation run.
- The Densify Connector, sends results to the Densify instance via the RESTful Web Service API. You can review the results in the Proactive Action Automation dashboard.
Data collection is scheduled to start at 12:05 am local time on the vCenter and connector. This schedule is set through the connector.
The control analytics generate the recommendations that can be automated. You can now review the recommendations and configure automation through Densify.
Additionally, a number of checks are done to verify the state of the vCenter so that the recommendations can be executed.
Communication is one way only, as the request for automation details is initiated by the connector, when automation is enabled.
In the Densify Console, click on Automation > Proactive Automation to open the page. You can use the tabs at the top of the page to review the two types of recommendations. Review the details for each cluster by clicking on the tab and then on the links for the selected cluster.
- Proactive Rebalance Moves—This tab provides a summary of the proposed moves to rebalance workloads over the available infrastructure and the results of the attempted action execution, if automation has been enabled on the cluster.
- Proactive Allocation Changes—This tab provides a summary of the proposed recommendations and the results of the attempted action execution, if automation has been enabled on the cluster.
- Proactive Automation Setup—This tab provides the setup options for each cluster.
After actions have been executed the power state of a VM remains unchanged. i.e. if the VM was running before proactive automation, then the VM will be running after. If the VM was off it will be left in that state. CPU or memory allocation changes can only be made to:
- VMs that are powered off;
- VMs that are hot-add-enabled;
- VMs that are running. in this case, Densify waits until the VM is next powered off and then applies the change. A vCenter alarm is set for when the VM is powered off.
- VMs that are running and can be shutdown, updated and powered on, once the update is complete.
Note: Real time automation must be enabled, in order to set the alarms and execute the required allocation changes.
Note: "Hot" allocation increases of vCPUs and memory are not supported on all OS/hardware combinations. Refer to the VMware documentation for detailed information.
- Click on Automation > Proactive Automation to open the dashboard.
- Use the global filter to select a subset of clusters, on which to action recommendations.
- Click on the Proactive Rebalance Moves tab to review the rebalancing moves for the scope of systems defined by the global filter.
- Click the Densify back button to return to the dashboard. Clicking the browser's back button logs you out of Densify.
- On the Proactive Allocation Changes tab, links are provided for undersized and oversized guests and links are also provided to show the specific details of the bump ups/downs for both CPU and memory allocations.
On this page, links are provided for "Hosts at Risk" and for "Rebalance Recommendations". Click the links to see details of the specific moves to be made and why these moves have been recommended.
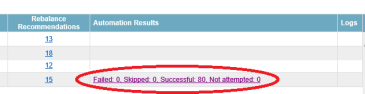
A summary of the results is provided in the last column. Click the link to open an Automation Results report. This table lists the details of the move and the status.

Proactive Allocation Changes Tab
The tabular data on this tab, allows you to review the recommendations and investigate individual systems more closely.
Table: Proactive Allocation Changes Report
|
Columnn |
Description |
|---|---|
|
vCenter | Environment | Cluster |
This column shows the name of the vCenter, the environment and cluster containing the impacted guests. |
|
Automation On |
Indicates whether or not Proactive Automation is enabled for this cluster. Contact [email protected] for details on enabling this feature. |
|
Undersized Guests |
This columns shows the number of undersized guests, displayed as a link. Click the link, to open the Undersized Guest Details report that shows each guest's system details as well as the reason why each listed guest is not sized efficiently. When you select a system in the Details report, utilization metrics, if available, are displayed on the Resource Utilization Metrics High/Low Limits tabs. Use the left/right arrows to scroll though the various workload charts. If no data has been collected or is not available, the corresponding chart is not displayed. Workload charts display current sustained activity in blue, while sustained activity on the recommended instance type chart is shown in green. The minimum and maximum utilization values are shown as vertical lines above and below the coloured block. The median is indicated as a black line within the coloured block. The average is indicated in brackets, in the sub-title of the chart. The scale used on the Y-axis is scaled dynamically to match the range of data. The pink line indicating the high policy limit setting is shown, and the setting of the Y-axis scale also accounts for this value. The yellow line indicates the policy low limit. If the high and low are the same, the dashed yellow/pink line indicates the value. Click on the System Details tab to see allocated resources and the relevant attributes that have been set for this guest. For more information about the Guest Details report for each cluster, see |
|
Bump Up Recommendations |
This is the number of allocation increases for the selected cluster. The value is displayed a link. Click the link to open the Bump Up Recommendations report. |
|
Oversized Guests |
This column shows the number of oversized guests. Click the link, to display the Oversized Guest Details report that shows each guest's details as well as the reason why each listed guest is not sized efficiently. When you select a system in the Details report, utilization metrics, if available, are displayed on the Resource Utilization Metrics High/Low Limits tabs. Use the left/right arrows to scroll though the various workload charts. If no data has been collected or is not available, the corresponding chart is not displayed. Workload charts display current sustained activity in blue, while sustained activity on the recommended instance type chart is shown in green. The minimum and maximum utilization values are shown as vertical lines above and below the coloured block. The median is indicated as a black line within the coloured block. The average is indicated in brackets, in the sub-title of the chart. The scale used on the Y-axis is scaled dynamically to match the range of data. The pink line indicating the high policy limit setting is shown, and the setting of the Y-axis scale also accounts for this value. The yellow line indicates the policy low limit. If the high and low are the same, the dashed yellow/pink line indicates the value. Click on the System Details tab to see allocated resources and the relevant attributes that have been set for this guest. For more information about the Guest Details report for each cluster, see |
|
Bump Down Recommendations |
This is the number of allocation increases for the selected cluster. The value is displayed as a link. Click the link to open the Bump Down Recommendations report. |
|
Automation Results |
This columns shows the status of the automation. Once automation has been run, the results are shown here. |
|
Logs |
This column provides links to the automation execution log files. |
You can export the content of the following reports:
- Undersized Guest Details and Oversized Guest Details
- Bump Up Recommendations and Bump Down Recommendations
Significant validation, of the clusters associated with Proactive Automation, is performed before any actions are executed. The validation is accomplished in multiple steps.
- DRS Validation—Two Densify settings are used to validate the vCenter DRS settings for infrastructure groups affected by Proactive Automation. These settings, "DRS Enabled" and "DRS Automation Level", are checked first and if the criteria are not met, then no further validation is performed and action automation is aborted. Contact [email protected] for additional information.
- Environment Validation—Compares Densify’s last known state of the environment to the state of environment at run time. The run time state is obtained via the vSphere API.
- Environment Drift—Looks for unexpected changes in the virtual environment such as:
- Changes in number of servers or VMs
- Changes in VM resource allocations
- Changes in VM placements
- Critical Drift—Densify looks for changes in the infrastructure group that causes a reduction in the assumed resource capacity.
- These types of changes include:
- In-scope host has been removed from the infrastructure group;
- A new VM has been added onto an in-scope host;
- The CPU or memory allocation has been increased, above the Densify expected value, on a VM;
- The recommendations should be executed as soon as possible after data collection completes
- Bookings should be implemented before the start of data collection or after the end of action automation execution.
- Placement Drift—Densify looks for changes in the placement of VMs on hosts. Any unexpected placement of a VM on a host is considered placement drift. This includes the following:
- VM moves from an in-scope host to an out-of scope host;
- VM moves from one host to another within the same infrastructure group;
- VM moves when validation finds that the VM is now located on an unexpected in-scope host.
- Placement Drift (#) this is an absolute number (10). When this value is met or exceeded, the automation is aborted.
- Placement Drift (%) which is defined as the number of changes divided by the total VMs on unexpected hosts. If this values exceeds 10% execution is aborted.
The environment is checked to make sure that actions can technically be executed before automation proceeds. For example, Densify verifies that vMotion is enabled on the hosts and whether there are any servers in maintenance mode.
Automation is aborted if a problem is detected. This includes critical or warning notifications on any infrastructure group associated with the recommendations.
All validation details are logged.
These changes may be caused by unplanned updates initiated by system administrators or automated systems such as DRS. Action automation evaluates the amount of environment drift and aborts execution if the risk is too high. The placement drift tolerance is specified on the Action Automation tab when you create/edit the Control Environment.
Note: When the CEI is less than 1.0 these drift checks are disabled. So when there are lots of available resources, the action automation proceeds.
Action automation will abort when any critical environment drift is detected. Details of the validation are logged. To increase the success of action automation:
This type of drift is more common due to the use of resource balancing tools like DRS. You define how many unexpected placements are allowed before automation aborts. There are two threshold settings:
If environment validation is successful, then Densify determines whether placement drift in the environment is within the pre-defined thresholds specified on the Action Automation tab. If the environment and placement drift is within the acceptable thresholds and the time for starting execution is within the specified time window, then Proactive Automation will run.
Once all of the validation is complete, and Proactive Automation is ready to run, DRS will be set to the most conservative setting so that changes can be made to the environment. When action execution is completed DRS will reset to the original value.
Note: If Proactive Automation exits unexpectedly, Densify will reset DRS to the original value on by the Densify Connector. You may want to verify that DRS has been reset to its original value.
Action automation will not proceed when there are critical or warning level notifications present for an infrastructure group, that will be affected by Proactive Automation. If the actions are not executed, the recommendations will continue to be displayed until the affected clusters are in the green.
Note: When you are working with Densify Connector v2.2.3 and vSphere 7.0, you may see warnings in the action automation log file regarding the vSphere version; however automation will still run.
Order of Execution
Once all the validation steps have been completed and Densify has determined that Proactive Automation can be executed, then the recommendations are executed in the following order:
- Move (rebalancing) are done according a sequence number.
- Execute allocation changes.
The Powershell script does all moves (so VMs are in their expected locations), then all allocations for each VM as a part of a group. This is done in case some actions may require a restart.
Proactive Automation and Software License Cost Optimization
If you are using the optional Software License Cost Optimization system, action automation combines with VMware's DRS to keep VMs on licensed hosts.
Once the Software License Cost Optimization (SLCO) package has been installed, by Densify, license optimization containment rules are deployed to the vCenter Server. After each data collection and analysis refresh, action automation moves systems according to SLC recommendations, as listed on the License Optimization Recommendations tab, if automation is enabled.
The DRS rules then maintain placement of managed VMs throughout the day, until the next data collection and refresh.
Reviewing Proactive Automation Results
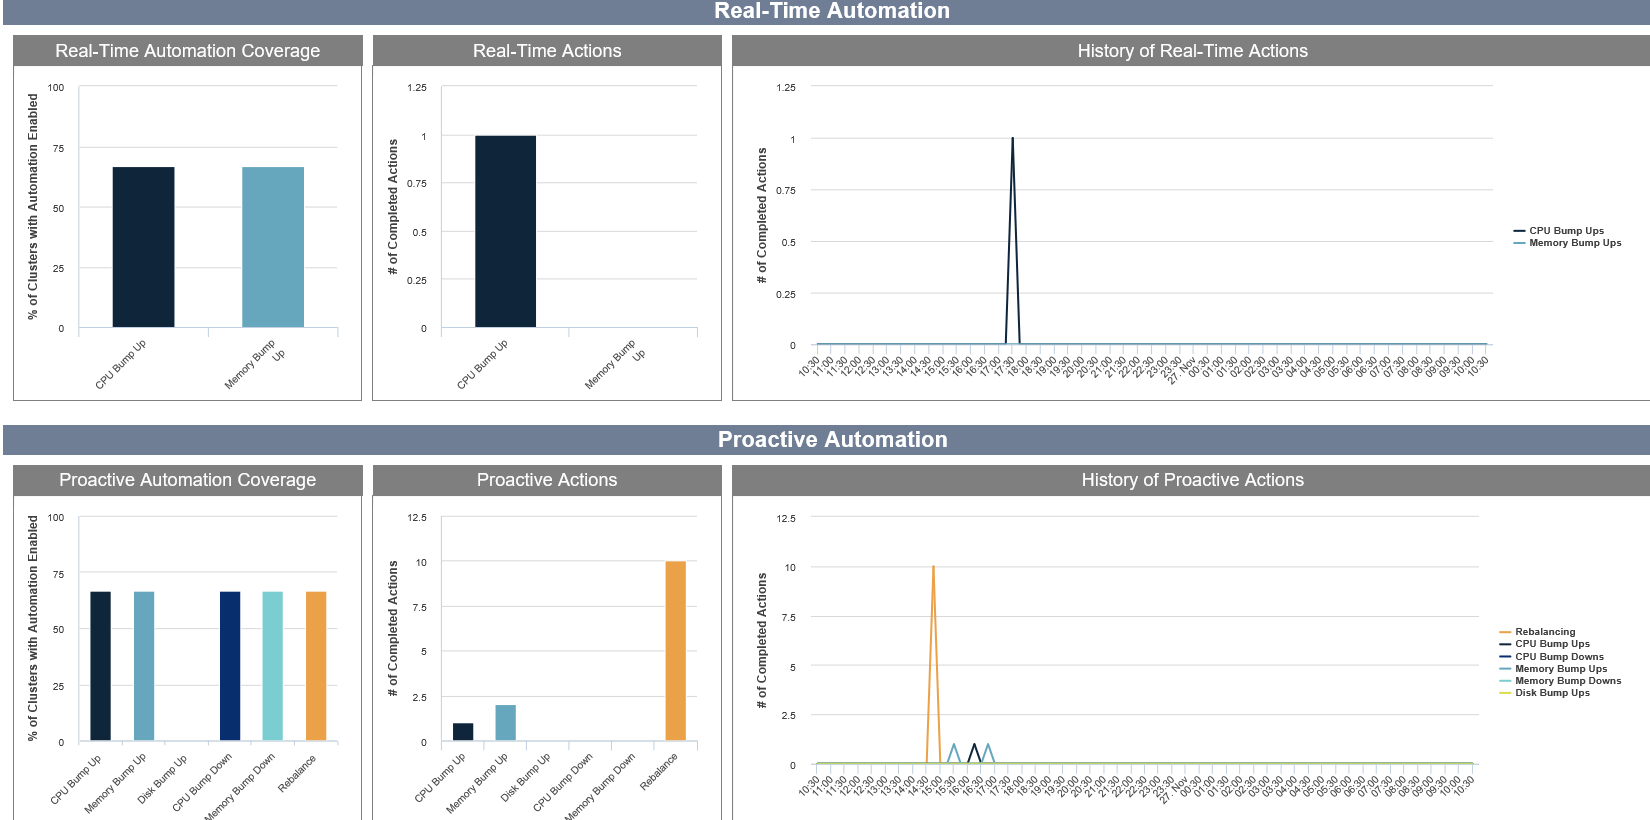
A set of reports accessed through the Automation > Automation Insight, provides a summary of Proactive Automation within your environments:
- Proactive Automation Coverage—This report provides details of the number of clusters for which automation is enabled, for each type of recommendation. Coverage is indicated as a percentage of VMs for which automation is enabled versus the recommendation type.
- Proactive Actions—This report shows the number of each recommendation type that has been completed, today after the most recent analysis refresh.
- History of Proactive Actions—This report shows the number of each recommendation type that have been completed over time.
Disabling Proactive Automation for a Set of Systems
You can disable the automated allocation changes for a set of systems. This affects only those allocation changes in which action automation has not yet started.
Contact [email protected] to disable automation of allocation changes for a set of systems.