Optimization Overview Report - Data Tab
Optimization Overview Report - Data Tab
#380740
The Optimization Overview report provides a summary of optimization opportunities and ways to mitigate risk for your public cloud instances. This report aggregates the analysis results for all your public cloud platforms.
Data is displayed as charts on the Summary tab or as detailed tabular data on the Data tab, covered here.
You can group and filter your data using the following options:
- Group By —See
- Recommendation Filter Menu—See
- Guest filter—See
Filter settings defined using any of the above options are persistent between user login sessions, for this page.
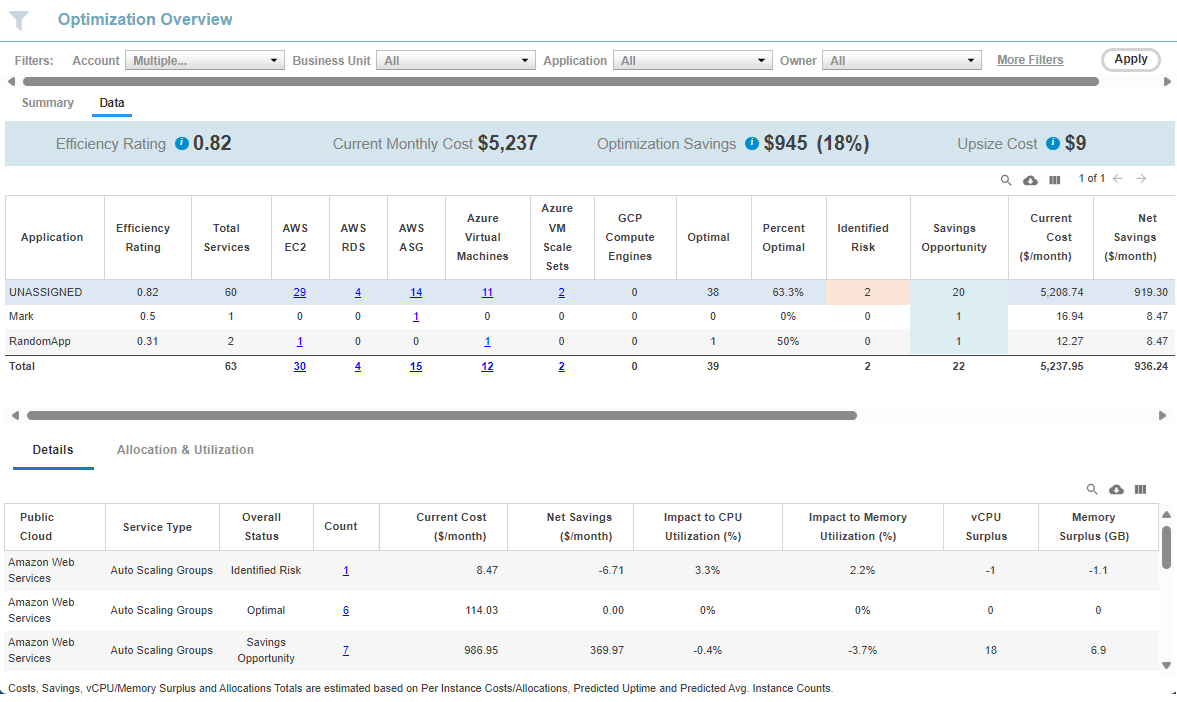
Key metrics are displayed in a banner at the top of the report. If you have applied filters, the totals, displayed in this summary, reflect the filtered results. See Summary Banner for details.
Data Controls
The controls, in the upper right corner of the page, provide options for managing and viewing your data more effectively. See Data Controls on Tabular Reports for more details.
The breakdown of the data for your aggregated cloud environment is displayed on this tab. You can control how the data is displayed in this table using the Group By feature. The Group By setting is used in the first column and data is retrieved and displayed accordingly.
For example, if you wanted to group the data based on Business Unit, Densify displays the analyzed data sorted based on the value of the Business Unit resouce tag. See
The top table provides a breakdown as follows:
Table: Optimization Overview - Data Tab Columns
|
Column(s) |
Description |
|---|---|
|
Group By selection: Account | Application | |
The first column is determined by your Group By selection. You can control how the data is displayed in this table using the Group By feature. Your Group By selection is used in the first column and data is retrieved and displayed accordingly. Account—The AWS account, Azure subscription or GCP project used for data collection. Application—The value of the application tag, You must set the resource tag for the instance accordingly. Availability Zone—The availability zone in which the instance is running. Business Unit—The value of the business unit tag, You must set the resource tag for the instance accordingly. Owner—The owner of the cloud instance. You must set the resource tag for the instance accordingly. Region—The region in which the instance is running. |
|
The Efficiency Rating provides an indication of the health of your aggregated environment. The value is indicated in red, when it is greater than 1.
|
|
|
Total Services |
The total number of services in the selected grouping. The grouping is defined in the first column. You can change the Grouping options using the Group By feature. |
|
AWS EC2 | AWS RDS | AWS ASG | Azure VM | GCP CE |
This a breakdown by instance type and cloud provider. The number of instances listed in this column is a hyperlink that takes you to the Instance Optimization Details page for the selected grouping. i.e. Only the specific systems, as indicated by the count in the originating table cell, are shown in the Instance Optimization Details. For more information, see For ASGs see |
|
Optimal | Identified Risk | Savings Opportunity |
These 3 columns provide a breakdown by recommendation type.
|
|
Percent Optimal (%) |
This is the percentage of total services that are currently sized correctly. |
|
Current Cost ($/month) |
The estimated cost is the aggregate cost of all of the services in the selected account, as indicated by Total Services for each row. The estimated cost (both current and recommended) takes into account uptime and does not assume systems are running all the time. |
|
Net Savings ($/month) |
If the recommendations are implemented, the net savings indicated here can be achieved. This value is calculated as the current estimated cost minus the estimated cost of the recommended instances. |
|
Impact to CPU Utilization (%) | Impact to Memory Utilization (%) |
These two columns indicate the percentage resource impact if the recommendations are made. |
|
vCPU Surplus | Memory Surplus (GB) |
These two columns indicate the change in actual vCPUs and memory that will result if the recommendations are made. vCPU Surplus is the difference between (SUM of the total Current vCPU - SUM of total Recommended vCPU). Memory Surplus is the difference between (SUM of the total memory - SUM of total Recommended memory) |
|
Current # of Instances | Recommended # of Instances |
These two columns indicate the current number of instances and the number of instances if the recommendations are made. This information can be useful when a group contains ASG instances. The average number of systems in the ASG is used for these value so the values shown in these 2 columns may not always be an integer. This average instance count can be found when you drill down to the Instance Optimization Details report in the "Current Predicted Average Instance Count" and "Recommended Predicted Average Instance Count" columns. see Additionally, you may observe that these values may not match the value of the Total Services. This happens because child ASGs are included in this calculation, whereas the Total Services only contains the parent ASG. |
|
Totals |
The totals at the bottom of the table indicate the total for each column, for all pages, if you have a multi-page report. Vertical scroll bars may be displayed to scroll through the entire list, so lower rows may be momentarily hidden behind the row of Totals. The number of instances listed in this column is a hyperlink that takes you to the Instance Optimization Details page for the selected grouping. i.e. Only the specific systems, as indicated by the count in the originating table cell, are shown in the Instance Optimization Details. For more information, see |
Note: Spot instances are not included in this table or in the Summary tab. Refer to Viewing Cloud Optimization Reports - RDS for details,
Details Tab
The details of the row selected in the top table is expanded and displayed on two tabs on the lower part of the page. The Details tab provides a subset of the information from the top of the page, for only the selected row, expanded by Service Type and sorted by Service Type and Overall Status, rather than aggregated.
Additionally, any filter criteria selected in the Guest Filter and Recommendation Filter are applied to the date displayed on both the Details and Allocations and Utilization tabs.
Note: In the following table, costs, savings, vCPU/memory surplus values and totals are estimated based on per instance costs and allocations, predicted uptime and predicted average instance counts. This is indicated as a footnote as the bottom of the page.
Table: Optimization Overview - Details Tab Columns
|
Column(s) |
Description |
|---|---|
|
Public Cloud |
This is the cloud vender associated with the row selected in the primary table at the top of the page. The value is one of Amazon Web Services, Microsoft Azure and Google Cloud. |
|
Service Type |
This is the type of service. The value is one of EC2, RDS, Auto Scaling Groups, Virtual Machines and Compute Engines. |
|
Overall Status |
This the recommendation for the selected account.
|
|
Count |
The total number of systems in the selected account, The number of instances listed in this column is a hyperlink that takes you to the Instance Optimization Details page for the selected grouping. i.e. Only the specific systems, as indicated by the count in the originating table cell, are shown in the Instance Optimization Details. For more information, see |
|
Current Cost ($/month) |
The estimated cost is the cost of all of the services of this type, as indicated by Count for each row. The estimated cost (both current and recommended) takes into account uptime, based on the assumption that services are not running all the time. |
|
Net Savings ($/month) |
If the recommendation is implemented, the net savings indicated here can be achieved. This value is calculated as the current estimated cost minus the estimated cost of the recommended instances. |
|
Impact to CPU Utilization (%) | Impact to Memory Utilization (%) |
These two columns indicate the percentage resource impact if the recommendation is made. |
|
vCPU Surplus | Memory Surplus (GB) |
These two columns indicate the change in actual vCPUs and memory that will result if the recommendation is made. |
Allocations and Utilization Tab
The allocation and utilization details of the row selected in the top table is expanded and displayed on this tab in the lower part of the page. The Allocations and Utilization tab provides a subset of the information shown at the top of the page, but only for the selected row.
Note: In the following table, all allocations totals are estimated based on per instance allocations, predicted uptime and predicted average instance counts. This is indicated in a footonote as the bottom of the page.
Note: In the following table, some values may not match the aggegated totals shown in the tabular report at the top of the page. This is due to how ASG and VM scale set utilization is calculated.
For each set of systems the average, maximum, minimum and total values are shown for each column.
Table: Optimization Overview - Allocations and Utilization Tab Columns
|
Column(s) |
Description |
|---|---|
|
Current vCPU |
These two columns indicate the current and recommended vCPU allocation. The average, maximum, minimum and total values are shown for the set of systems identified in the selected row. Systems with 'Terminate' recommendation, are excluded from the calculation in the 'Recommended' columns. If all of the systems in the group have a 'Terminate' recommendation, the values in Recommended columns will be indicated as a dash (-). |
|
Recommended vCPU |
|
|
Current CPU Benchmark |
These two columns indicate the current and recommended CPU benchmark values. |
|
Recommended CPU Benchmark |
|
|
Current Memory Allocation (GB) |
These two columns indicate the current and recommended memory allocation. The average, maximum, minimum and total values are shown for the set of systems identified in the selected row. |
|
Recommended Memory Allocation (GB) |
|
|
Current Predicted CPU Utilization (% |
These two columns indicate the current CPU utilization and the CPU utilization on the recommended instance, based on the current uptime. |
|
Recommended Predicted CPU Utilization (%) |
|
|
Current Predicted Memory Utilization (%) |
These two columns indicate the current memory utilization and the memory utilization on the recommended instance, based on the current uptime. |
|
Recommended Predicted Memory Utilization (%) |
|
|
Disk I/O (MB/s) |
The disk I/O for the current set of instances. If a system is missing disk or network data, it cannot be included in these totals. |
|
Disk I/O Operations (IOPs) |
The disk I/O operations for the current set of instances. |
|
Network I/O (MB/s) |
The network I/O for the current set of instances in MB/s. |
|
Network I/O (packets/s) |
The network I/O for the current set of instances in packets/s. |
Please observe the following for this set of data:
- The Average Utilization % value is calculated as the weighted average of the utilization % for all of the systems in the selected group. This is applicable to the current and recommended Utilization % for CU and memory.
- Systems with missing data are excluded from the calculations;
- If there is no data for a whole group of systems, then this is indicated as a dash (-);
- Systems with a "Terminate" recommendation are excluded from the calculations in all of the "Recommended" columns. For example, if all systems in the group are 'Terminate', then all of the "Recommended" columns will be shown as a dash (-);