Containers Data Forwarder with Authenticated Prometheus
Containers Data Forwarder with Authenticated Prometheus
#410180
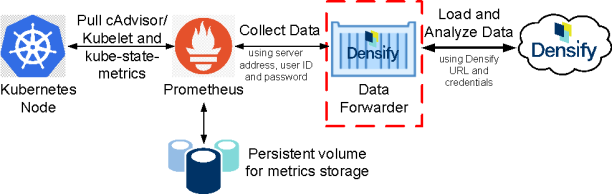
The Data Forwarder is an on-demand container that collects your container environment data from Kubernetes via Prometheus and forwards that data to Densify for analysis.
This topic shows you how to configure the Data Forwarder with an authenticated Prometheus server for data collection using YAML files. By default, the Prometheus server is secured when it is part of Red Hat OpenShift deployment. Therefore, the instructions in this topic use the OpenShift CLI for configuring the Data Forwarder with the authenticated Prometheus server. See Containers Data Forwarder with Prometheus for details for configuring a non-athenticated connection.
After deploying the Data Forwarder, contact [email protected] to enable your Densify instance with container optimization.
The following software is required for Densify container data collection and optimization.
- Densify account—Contact Densify for details of your subscription or sign up for a free trial.
- Kubernetes or OpenShift must be deployed.
- Running cAdvisor as part of the kubelet provides the workload and configuration data required by Densify.
- kube-state-metrics—This service monitors the Kubernetes API server and generates metrics from the various objects inside the individual Kubernetes components. This service provides orchestration and cluster level metrics such as deployments, pod metrics, resource reservation, etc. The collected metrics allow Densify to get a complete picture of how your containers are setup. i.e. Replica Sets, Deployments, Pod and Container Labels.
- Requires v1.5.0 or later. There are additional considerations when using v2.x. See below.
- https://github.com/kubernetes/kube-state-metrics
- Prometheus—Collects metrics from configured targets at given intervals. It provides the monitoring/data aggregation layer. It must be deployed and configured to collect kube-state-metrics and cAdvisor/kubelet metrics.
- Node Exporter—This is an agent deployed on every node to collect data about the nodes, on which the containers are running. This provides the required host-related metrics such as CPU, mem, network, etc.
The following item is not mandatory but provides additional environment information for Densify's container optimization analysis.
- Openshift-state-metrics—Expands upon kube-state-metrics by adding metrics for OpenShift-specific resources and provide additional details such as Cluster Resource Quotas (CRQ).
When deploying Prometheus and kube-state-metrics using a standard operator, some of the metrics that Densify needs for analysis may be excluded (i.e. on a deny list). Refer to Prometheus-Data.md for details of the required metrics.
Contact [email protected] for configuration details.
Additional Configuration for kube-state-metrics v2.x and Higher
Kubernetes Labels in kube-state-metrics
In kube-state-metrics v2.x features have been added to improve performance of both kube-state-metrics, itself and the Prometheus server that collects the resulting data.
One of these improvements affects the usage of Kubernetes object labels and annotations as Prometheus labels of the kube-state-metrics datapoints. In v2.x kube-state-metric, the default settings no longer include the collection of the Kubernetes object labels nor annotations and you need to configure the collection of these items using the command-line options.
Densify Container Data Collection and Kubernetes Labels
Though Densify's container data collection will work without the Kubernetes object labels as kube-state-metrics labels, you may want to enable the kube-state-metrics labels for the following use cases:
- Node group data collection requires the node labels.
- Data collection of other Kubernetes objects attempts to collect labels and annotations. These can be used to sort and filter containers in the UI or API and to create customized reports.
Node Groups
Node groups are not a Kubernetes feature, but rather are implemented by the public cloud provider's Kubernetes solution (e.g. AWS EKS, GCP GKE, Azure AKS). They are also used by 3rd party tools to provision the Kubernetes cluster (e.g. eksctl, kops).
Collecting node group data is only meaningful if you are able to match it to the public cloud provider's node group data (e.g. AWS ASG). In this case you need to enable node group data collection with kube-state-metrics version v2.x or higher.
- Add the following command-line argument to the kube-state-metrics container:
["--metric-labels-allowlist=nodes=[*]"]
If the performance of kube-state-metrics and/or Prometheus is a consideration, you can replace the wildcard (*)with a comma-separated list of specific node labels. This requires specific knowledge of the available node labels in the cluster, which depends on the cloud provider's Kubernetes solution and/or the 3rd party tool used to provision the cluster and their versions.
Labels of other Kubernetes objects
In addition to node labels, Densify attempts to collect the following data, which can be further used as sort/filter criteria and to generate custom reports:
Table: Optional Node Labels and Annotations
|
Labels |
Annotations |
|
|
|
|
- If you want to collect this data with kube-state-metrics v2.x or higher, add the following command-line arguments to the kube-state-metrics container:
["--metric-labels-allowlist=nodes=[*],namespaces=[*],pods=[*],deployments=[*],replicasets=[*],daemonsets=[*],statefulsets=[*],jobs=[*],cronjobs=[*],horizontalpodautoscalers=[*]", "--metric-annotations-allowlist=namespaces=[*]"]
Optionally, you can specify only the Kubernetes object labels that you need. Contact [email protected] for details.
Deploying the Data Forwarder for Data Collection
To configure the Data Forwarder, you need to:
- Download 6 files from Densify's GitHub page. See Downloading the Data Forwarder YAML Files.
-
Update the required YAML files to provide connectivity parameters. See Configuring the Data Forwarder.
- Create the service account, cluster role, and cluster role binding before testing the Data Forwarder functionality in your cluster. See Creating the Cluster Role Binding and Testing the Data Forwarder.
- Schedule the cron job to run the Data Forwarder pod regularly. See Scheduling the Data Forwarder.
Downloading the Data Forwarder YAML Files
- Navigate to: https://github.com/densify-dev/Container-Optimization-Data-Forwarder/tree/master/examples/AuthenticatedPrometheus and save the following files to your local working directory:
- clusterrole.yml
- clusterrolebinding.yml
- configmap.yml
- cronjob.yml
- pod.yml
- serviceaccount.yml
Note: Save the raw version of the files to avoid any unwanted characters (i.e. click on the top right Raw button from the GitHub text viewer to open the raw text file in a new browser tab, then save the file to your local working directory).
Configuring the Data Forwarder
- Open configmap.yml and edit the parameters shown in Table: Cluster Role Binding Setting, below.
- All other sections of the configmap.yml file are optional. Depending on your environment, you may need to configure additional parameters in configmap.yml. Refer to the file directly to see descriptions of the additional settings.
- Open clusterrolebinding.yml and edit the following parameter:
- Once you have updated the files with your settings, then place them in your CLI working directory where you manage your cluster.
Table: Cluster Role Binding Setting
|
Term |
Description |
Value |
|
namespace |
Specify the namespace that will be used to run the Data Forwarder. In OpenShift, the term "Project" is used instead of namespace, so specify the Openshift project name that will be used to run the Data Forwarder. |
namespace |
Table: Data Forwarder Settings
|
Term |
Description |
Value |
|
Host Definition Section |
||
|
host |
Specify your Densify server host (e.g. myCompany.densify.com). You may need to specify the Densify server’s DNS name, fully qualified domain name (FQDN) or IP address. |
<host> |
|
protocol |
Specify the protocol to be used to connect to the Densify REST API interface. Select http or https. |
https |
|
port |
Specify the TCP/IP port used to connect to the Densify server. You should not need to change this port number. See the Densify URL. |
443 |
|
endpoint |
This is the connection endpoint for the API. You can leave the default value. |
/CIRBA/api/v2/ |
|
user |
Specify the Densify user account that the Data Forwarder will use. This user must already exist in your Densify instance and have API access privileges. Contact [email protected] for the Densify user and epassword required to connect to your Densify instance. This user will be authenticated by the Densify server. |
<user name> |
|
password |
Specify the password associated with user, indicated above. Specify the password in plaintext. |
|
|
epassword |
Specify epassword (i.e. encrypted password) for the Densify user. The password must be encryptedand supersedes any value that has been specified in the password field, above. Typically, the epassword is used. Comment out the password line if it is not used. Typically, [email protected] will provide a Densify username and corresponding epassword when you are setup for container data collection. |
<encrypted password> |
|
Specify Settings for Prometheus to use for Data Collection |
||
|
prometheus_address |
Specify the Prometheus address. Typically, Data Forwarder is deployed in the same cluster as the Prometheus server, therefore you need to specify the internal service name of Prometheus, in the following format: <service name>.<namespace>.svc For HTTPS, the certificate is only valid for this service name. You may need to specify the fully qualified domain name by appending ".<cluster>.local" after the ".svc" string. If Data Forwarder is not deployed in the same cluster as Prometheus, you need to specify a fully qualified domain name. (i.e. kubemain.int.cirba.com) |
<service name>. |
|
prometheus_port |
Specify your Prometheus service connection port. The default port is 9090. Ensure that this port is the web port associated with the Prometheus service name specified in prometheus_address. |
9090 |
|
prometheus_protocol |
Specify https for your secured Prometheus server. |
https |
|
cluster_name |
Optionally, specify a name by which to identify this cluster within Densify. It is highly recommended that you provide a name here for ease of management and reporting. |
<cluster_name> |
|
prometheus_oauth_token |
Enable this parameter (i.e. uncomment this line). This parameter specifies the default path where the authentication token is stored: /var/run/secretes/kubernetes.io/serviceaccount/token |
<path> |
|
ca_certificate |
Enable this parameter (i.e. uncomment this line). This parameter specifies the default path to the service account certificate: /var/run/secretes/kubernetes.io/serviceaccount/service-ca.crt |
<path> |
|
Client Transfer Settings |
||
|
zipname |
Specify a name for the compressed file. Use the cluster name or the Prometheus server name or another name to identify the cluster data. The zipname will be prepended to the transferred file names. |
<zip file name> |
Configuring the Data Forwarder to Use a Proxy Host
If you need to configure data collection through a proxy server, then you need to specify the connection details in the corresponding section of the file.
The following settings are only applicable if the first setting, <proxyhost> is defined.
Table: Data Forwarder Proxy Host Settings
|
Term |
Description |
Value |
|
Proxy Host Definition Section |
||
|
proxyhost |
If defined, then the forwarder will route all Densify traffic through this proxy host. If not defined or blank, then all of the proxy-related parameters below are ignored. |
<proxy.host. |
|
proxyport |
Specify the port to be used to connect to the proxy host. |
443 |
|
proxyprotocol |
Specify the protocol to be used to communicate between the proxy and the application. Specify http or https. |
https |
|
proxyuser |
Specify the user name to provide to the proxy, when authentication is required. If you are using NTLM authentication, do not specify the domain prefix (i.e. specify only ‘user’, not ‘domain\user’) |
<user name> |
|
proxypassword |
When authentication required, Specify the password associated with proxy user, indicated above. Specify the password in plaintext. |
|
|
eproxypassword |
Specify epassword (i.e. encrypted password) for the Densify user. The password must be encryptedand supersedes any value that has been specified in the password field, above. . |
<encryted password> |
|
proxyauth |
Specify the authentication scheme to be used by the proxy. Select Basic (username/password) or NTLM. If you select NTLM then you also need to specfiy the proxyserver and proxydomain parameters, below. If you are using an unauthenticated proxy host, then leave this setting commented out. |
Basic |
|
proxyserver |
Specify the proxy server name. |
|
|
proxydomain |
Specify the proxy server’s domain. |
|
Creating the Cluster Role Binding and Testing the Data Forwarder
Once the Data Forwarder YML files have been updated with your connection parameters, you can create and test your pod. The instructions below uses the OpenShift CLI "oc" command, however, you could replace "oc" with "kubectl" if you are using kubectl to manage your cluster.
- Using the OpenShift CLI, log into your cluster.
- Create the service account that the container will use to authenticate the namespace.
- Create the cluster role.
- Create the cluster role binding to set the namespace|project that will be used to run the Data Forwarder.
- Create the configmap.
- Create the pod to test the Data Forwarder using pod.yml.
- Run the following command to review the pod status:
- You can use the pod ID to review the log file for the job execution.
- Optionally, once you have reviewed the logs you can remove the pod, as it is no longer required:
oc login
Provide your secured OpenShift server URL and login credentials.
oc create -f serviceaccount.yml
oc create -f clusterrole.yml
oc create -f clusterrolebinding.yml
Ensure that clusterrolebinding.yml has been updated with the namespace|project used to run the Data Forwarder.
oc create -f configmap.yml
oc create -f pod.yml
This command creates the pod based on configmap.yml. The running pod collects, compresses, and transfers the container data to your Densify instance. Once the data has been collected and sent to your Densify instance, the pod terminates.
oc get pods
The command should return the details of the pod. The status will be similar to:
densify 0/1 Completed 0 1m
oc logs densify
Review the content of the log file to verify successful completion of data collection and transfer of the compressed data file to your Densify instance.
{"level":"info","pkg":"default","time":1682517791260344,"caller":"src/densify.com/forwarderv2/files.go:88","goid":1,"message":"zipping mycluster.zip, contents: cluster - 21 files; container - 16 files; node - 17 files; node_group - 0 files; hpa - 6 files; rq - 0 files; crq - 0 files; total - 60 files"}
{"level":"info","pkg":"default","file":"mycluster.zip","time":1682517791462827,"caller":"src/densify.com/forwarderv2/main.go:49","goid":1,"message":"file uploaded successfully"}
The number of compressed and uploaded files (displayed at the end of the log) is dependent on the types of pods you are running in your cluster and if you have enabled the optional node-exporter component. An indication of a successful data transfer is determined when the number of uploaded files range from 20 to 70.
If you see 7 files uploaded, then this indicates a transferring problem. You need to review the log to determine the issue.
oc delete -f pod.yml
You now need to schedule the pod to run at the same interval you are using for data collection, as defined in the configmap.yml.
- Create the CronJob object using the following command:
- You can use the get pods command to review the last 3 jobs that were executed successfully. If there is a failure for any reason, the pod history is retained.
oc create -f cronjob.yml
Similar to pod.yml, this command creates the pod according to the details provided by configmap.yml. Additionally it creates the cron job that runs the pod hourly, on the hour.
You can now let [email protected] know that Data Forwarder is running and to enable your Densify instance with container optimization.
Get Pods
# kubectl get pods -n collector
NAME                           READY   STATUS      RESTARTS   AGE
densify                        0/1     Completed   0          14s
densify-job-1601654400-k2d8w   0/1     Completed   0          164m
densify-job-1601658000-zj29f   0/1     Completed   0          104m
densify-job-1601661600-6fnq4 0/1 Completed 0 44mNote: Deploying and scheduling the Data Forwarder can also be accomplished using the Red Hat OpenShift Container Platform console. The steps to deploy the Data Forwarder in the Openshift console are similar to the command line above (i.e. create the service account, the cluster role, the cluster role binding, the config map, the pod, and the cronjob).