DCE System Health Tab
DCE System Health Tab
#171190
This tab provides two types of system health—one based on the real-time placement validation and the other based on system health profiles. You can use the information listed here to diagnose issues with your target host systems.
To view this tab:
- In the Analysis Console, navigate to Analysis Workbench > Data Center Explorer.
- Define the scope of systems on which you want to report.
- Click the System Health tab.
Monitoring for Real-Time Placement Validation
Densify provides placements for today based on current host health status. The target host health may change over time to over-utilized, offline or in maintenance mode, which would make placement recommendations invalid.
System Health Profiles
Densify System Health profiles provide enterprise views of capacity health. Capacity planners can plan for both physical and virtual infrastructure by examining historical resource utilization trends and patterns through graphical system health dashboards.
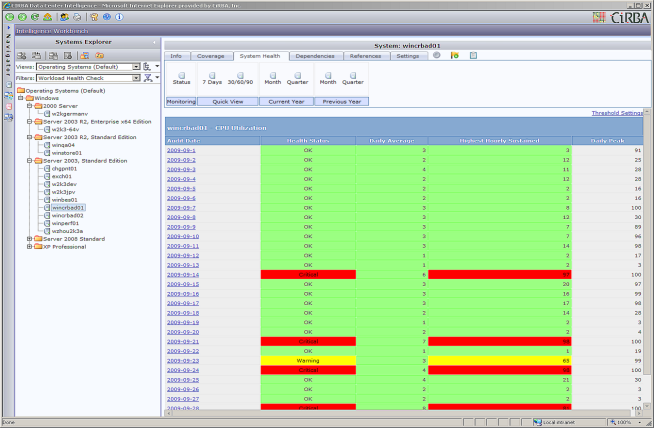
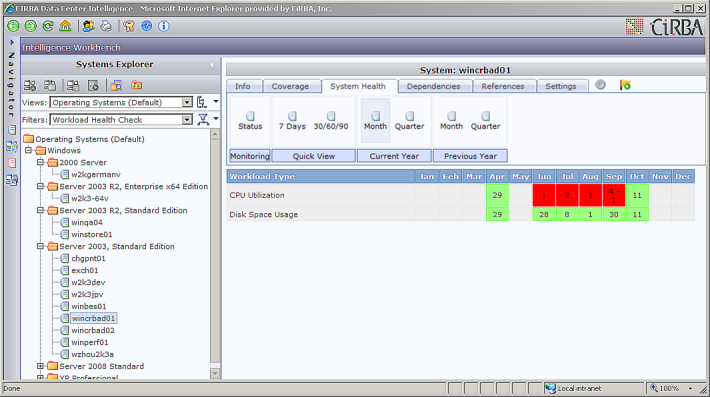
System Health dashboards provide color-coded status on the workload health of a system based on threshold settings configured in Administration > System Health Profiles. It is here, where profiles are created based on the Health Profile attribute and workload type.
Once system health profiles are configured and systems are assigned with the appropriate health profile attribute, the system health dashboard will display the historical resource utilization in both a rolling timeframe and calendar period.
The status is based on defined critical and warning thresholds per system per workload type for Sustained, Peak and Average Utilization at a daily level.
- Green cells indicate that workload utilization has not exceeded the threshold values.
- Yellow cells indicate that workload utilization has met and/or exceeded the warning threshold.
- Red cells indicate that workload utilization has met and/or exceeded the critical threshold.
- Gray cells indicate missing workload data or a threshold was not configured.
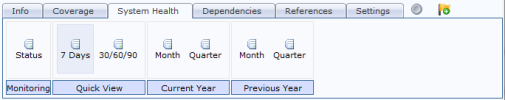
Table: System Health Tab Toolbar Buttons
|
Button |
Description |
|
Monitoring |
|
|
|
The health status of the host systems in the defined scope. This information is updated when real-time placement validation is enabled. . |
|
Quick View |
|
|
|
A rolling 7 day view of system health. Starts from today and goes back six days. |
|
|
A rolling 30, 60, 90 day view of system health. Starts from today and goes back 30 days. |
|
Current Year |
|
|
|
Provides a monthly view of system health. Starts from the current month and goes back to the start of the year. |
|
|
Provides a quarterly view of system health. Starts from the current quarter and goes back previous quarters. |
|
Previous Year |
|
|
|
Looks to the previous year by month. |
|
|
Looks to the previous year by quarter. |


Note: Health status only pertains to VMware and OpenStack KVM hosts, with real-time placement validation enabled. Note that only hosts are monitored here and not datastores.
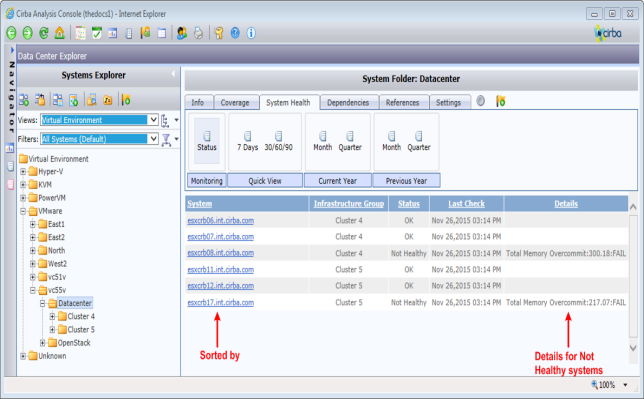
The dashboard is used to verify monitoring is enabled and to display the currently known health status of host systems in scope. This provides you with the system name, the containing infrastructure group, status ("OK", "Not Healthy", "Not Monitored"), date/time of last health check, and details. If a system is "Not Healthy", the Details column specifies the reason why the system is unhealthy.
For VMware host systems, a status of "Not Healthy" can have the following possible examples for the Details column:
- Status:RED:FAIL—host is in the red (this is a configurable VMware's host status)
- <metric>:<metric value>:FAIL—the metric has exceeded its limit defined by the corresponding policy setting.
- Status Override Executed—the host health is overridden using the API /monitored-hosts object (see
For VMware, host health details provided in the Details column is obtained directly from vCenter (unless overridden through the API). If you require further details, you need to log into the vCenter Server and check the status of the host device.
For OpenStack KVM, as health status is defined manually, the Details column only shows "Status Override Executed" if the host health is overridden through the /monitored-hosts API.
All columns are sortable. By default, the sort order is by the System column, in ascending order, case insensitive.
Clicking on a system hyperlink displays the System Dashboard for that system.
Only monitored host systems in your DCE scope are listed, even if non-host systems (e.g. VMs) or hosts that are not monitored are included. If no monitored system is in scope, a message is displayed "Monitored hosts not found".
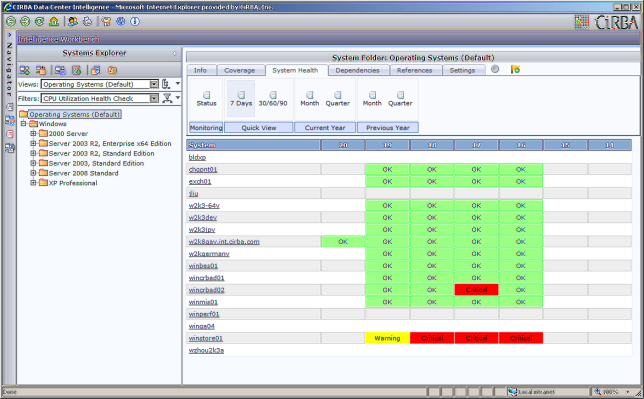
Folder-Level System Health Profile Dashboard
- Viewing system health from the folder node will provide a rolled up view of color-coded system status
- Clicking on the system name link will navigate to the health dashboard for the specific system
System-Level System Health Profile Dashboard
- The number specified in the cell indicates the number of days that met that threshold. If the time period encounters both warning and critical thresholds then both number of days for each threshold type will display. This is illustrated in the sample figure for the month of September (4-1); this means that 4 days met or exceeded the critical threshold and 1 day met or exceeded the warning threshold.
- Clicking on the number link will display the entire workload activity for the specified time period.
Health Profile Details by Workload Type
- Click the Threshold Settings link to view configured thresholds.
- Click the Audit Data link to view the Hourly Workload Chart.