Using the Tree Viewer
Using the Tree Viewer
#380110
The tree viewer offers an intuitive and efficient way to navigate and explore your Kubernetes environment.
Figure: Locating the Container Tree Viewer

|
|
Use the node tree viewer to navigate node groups. |
|
|
Use the cloud tree viewer to navigate your public cloud environments. |


Use the tree viewer to select the scope of systems on which to report. As you navigate through the tree, the reports on the right update automatically to show your selected scope.
Hiding the Tree Viewer
Once you have selected the scope of systems to review you can hide the tree viewer. If you are working on a smaller screen or laptop it will be easier to view tables and charts with the increased screen space.
|
|
By default, the tree view is pinned to the left side of the screen. When the viewer is pinned, click the chevrons to open/close the tree viewer. |
|
|
Click the pin to hide the tree viewer. Use the |


 icon on to open it as required and the X to close it when not required.
Views and Filters
The default view is your container hierarchy i.e. Clusters > Namespaces > Pods > Containers. These views can be customized to better manage your data. See Creating Custom Views.
You can also create customized filters to manage large sets of data. See Creating Custom Filters.
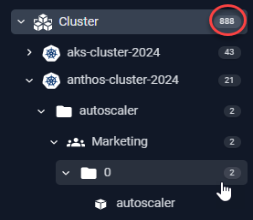
Counts
You can see a count of the number of manifests at each branch of the tree viewer.
When you are viewing counts on the Summary or AI Analysis Details pages, these counts will be containers and will not match the manifest counts shown in the tree viewer.
Figure: Manifest Counts
Navigating the Tree Viewer
The following icons are available, by default. You can create custom views based on other attributes that may not include any of the following items.
|
Icon |
Entity |
Description |
|---|---|---|

|
Kubernetes Environment |
The top level entity that contains your infrastructure. |

|
Kubernetes Cluster |
This represents a Kubernetes cluster that contains the node or group of nodes that manage, deploy, and scale your applications. |

|
Namespace |
This represents the namespace that is a logical partition within a cluster that organizes and manages resources such as pods, services, and deployments. |

|
Pod |
This represents a pod that is the smallest, deployable unit in Kubernetes. It represents a single instance of a running process in a cluster and contains one or more closely related containers that share the same resources and network. |

|
Container |
The bottom level is the container that is the runtime unit within a pod and encapsulates an application along with its dependencies. |

|
Business Unit |
Business unit is commonly used to group systems. This is based on a container label and can be used to create custom views. |

|
Other Grouping |
Represents other attributes or labels that have been used to group the data. |
Using Tabs to View the Selected Systems
Based on your selection in the tree viewer various tabs are displayed to view the selected data. When multiple systems are selected you see:
- Summary—Shows you summary of how effectively your resources are being utilized.
- Breakdown—Shows you a breakdown of the items, selected in the tree view, providing a high-level comparison.
- Histograms—Shows you the selected scope of your environment as set of histograms.
- AI Analysis—Shows analysis details of the selected scope of your environment in various tabular views with utilization charts for selected systems.
- Policies—Shows you details of the policy that was used to generate your analysis results.
When a single container is selected you see:
- Overview—Shows you the utilization and recommendation details for the selected container.
- GPU—Shows you the utilization details for the selected GPU instance.
- Metrics Viewer—Shows you collected and analyzed data for a specific container.