Using the Node Tree Viewer
Using Node the Tree Viewer
#380
Using the Node Tree Viewer
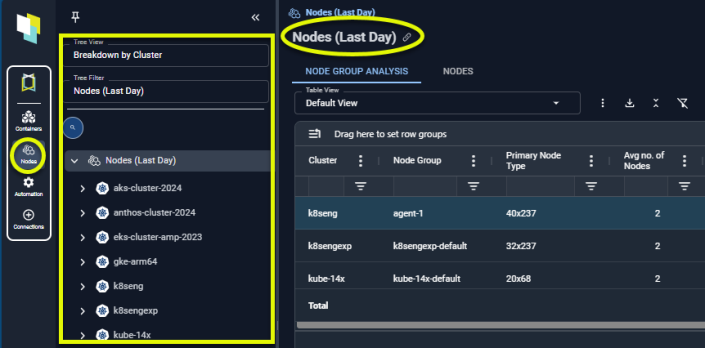
The node tree viewer offers an intuitive and efficient way to navigate and explore your node groups. Nodes and Node Groups Node that have been discovered in the last day are displayed in the tree viewer,
Figure: Locating the Node Tree Viewer
|
|
Use the container tree viewer to navigate your container environment. |

Use the tree viewer to select the scope of nodes on which to report. As you navigate through the tree, the reports on the right update automatically to show the selected scope.
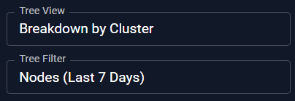
Views and Filters
The default view is your container hierarchy i.e. Clusters > Node Groups > Individual Nodes. These views can be customized to better manage your data. See Creating Views from a Table.
Figure: Selecting View and Filter Options for the Tree View
Counts
You can see a count of the number of nodes at each branch of the tree viewer.
Figure: Node Counts

Navigating the Tree Viewer
The following icons are available, by default. You can create custom views based on other attributes that may not include any of the following items.
|
Icon |
Entity |
Description |
|---|---|---|

|
All Nodes |
The top level entity that shows your infrastructure. |

|
Kubernetes Cluster |
This represents a Kubernetes cluster that contains the node or group of nodes that manage, deploy, and scale your applications. |

|
Node Group |
This represents one node group. |

|
Node |
This represents a single node. |

|
Other Grouping |
Represents other attributes or labels that have been used to group the data. |
Using Tabs to View the Selected Systems
Based on your selection in the tree viewer various tabs are displayed to view the selected data. When multiple systems are selected you see:
- Node Groups—Shows you the selected scope in a tabular view. Three views are provided and you can create customized views by selecting only the required columns and saving the results
- Nodes—Shows you the details of individual nodes. Again, the content of the report is based on your selection in the tree viewer.
When a single node is selected you see:
- Overview—Shows you the utilization and recommendation details for a single node.
- GPU—Shows you the GPU resource allocation and utilization details for a single node with configured GPU resources.
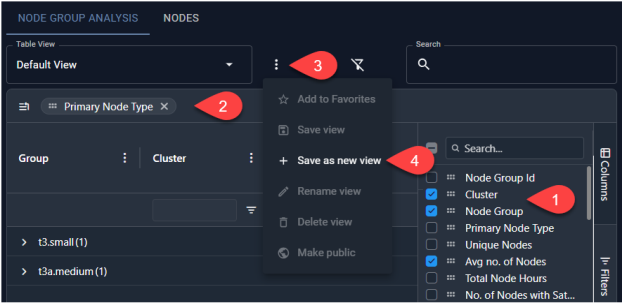
Creating Views from a Table
You can also create a view directly from the table, using the columns to define your view:
- Select the columns to be added and/or removed.
- Drag any column to the header bar to group the data by the selected item.
- Once the data is organized to meet your requirements, open the context menu.
- Click +Save as new view and enter a name for your view.
Figure: Manage Views Context Menu