Node Overview Tab
Node Overview Tab
#38xxx
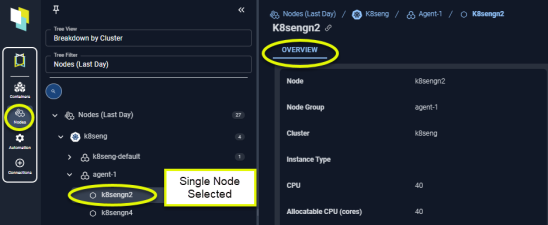
The cards on this tab provide a visual overview of a single node. When navigating the tree viewer, you will see this tab when a single node is selected.
You can also reach the modal view of this page, from the Node Details page by clicking the name, in the Node column.
Figure: Locating the Node Overview
Summary Card
Click any of the listed settings below to see a brief description. Complete descriptions of each setting are provided in the Nodes Tab.
Resource configuration details are listed on this card.
Figure: Summary Card
![]()
Node Information
Identifying details and key metrics are displayed in the card at the top of the page.
Figure: Node Information
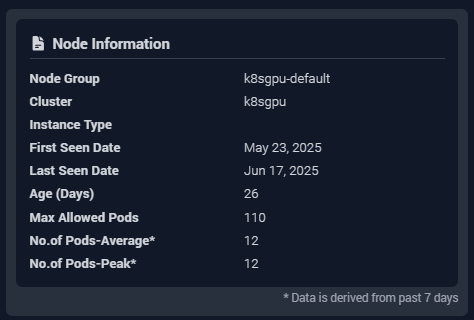
Please observe the following for this set of data:
- Missing data is indicated with a dash (-).
- The data is derived from the past 7 days of history.
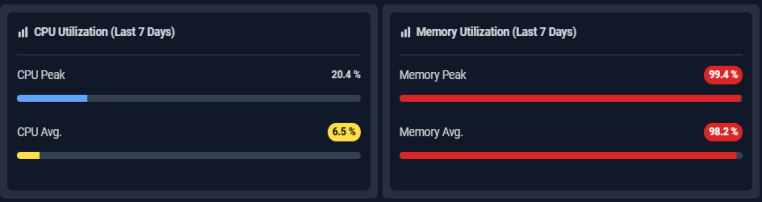
Utilization Summary
The next 2 cards summarize potential resource risks for the node, and the containers running on the node.
Figure: Utilization Details
GPU Summary
This card summarizes the GPU allocation and for the selected node. This card is only displayed if GPU resources are availble on the selected instance type. A hyperlink at the bottom of the card takes you to the GPU page.
Figure: GPU Summary
![]()
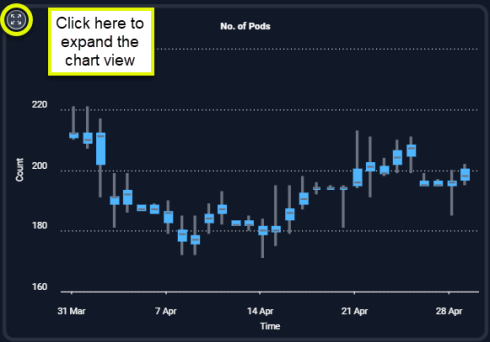
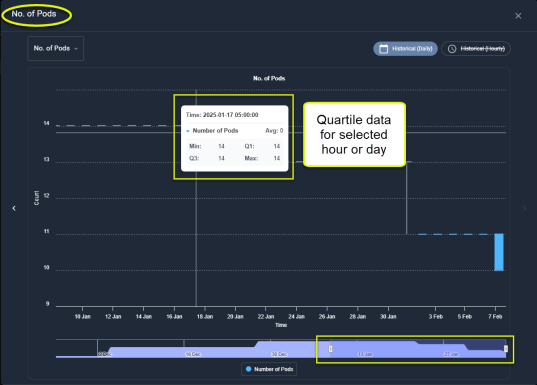
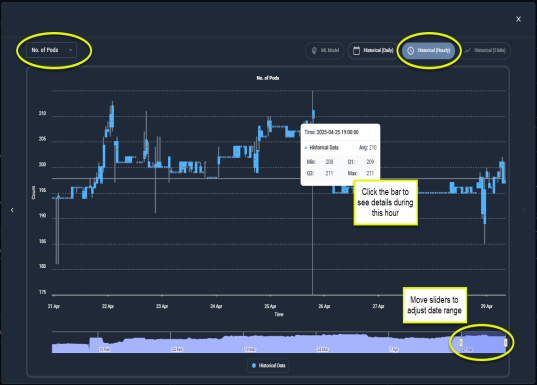
Number of Pods and Utilization Charts
This chart summarizes the number of pods that have been running on this node. You can open a modal view to see more details. See AI Analysis Details Table for details on using the options in the modal view.
Slide Show: Number of Pods Chart (Click left/right arrows to see the other slides.)
Expand to Modal View
Number of Pods - Modal View (Daily)
Number of Pods - Modal View (Hourly)
Selecting Other Metrics
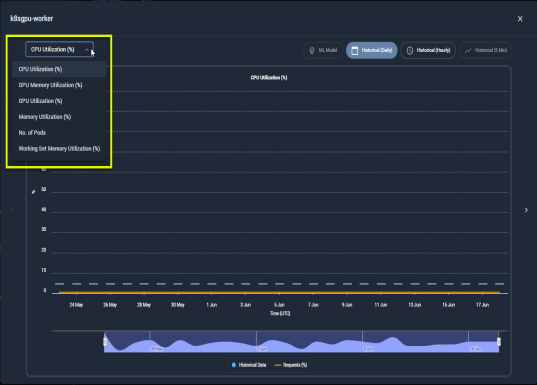
Utilization Charts
The last section provides utilization charts that show hourly min/max and sustained activity for the selected node. You can also expand any chart to the modal view and select other metrics for review. See AI Analysis Details Table for details on using these charts to review workload data.
|
|