Node Group Waste View
Node Group Waste View
#380
The Node Group Waste page provides details of wasted resources in your node groups, highlighting resource over-provisioning. You can also see information about the primary constraint and the optimal instance type that could be used when the environment is optimized.
Figure: Locating the Node Group Waste View
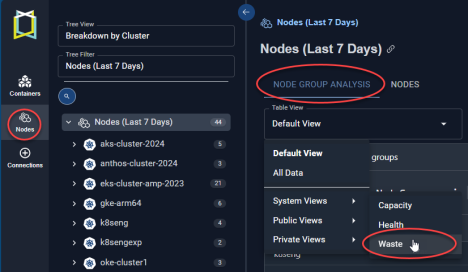
With this information, you can find the node groups with estimated waste, identify the primary constraint such as CPU requests.
You can create filters at the column or table level. See Using Filters.
Review the detailed report in this table to optimize your node health.
|
Column Name |
Description |
|---|---|
|
Cluster |
The cluster name containing the node group. By default this table is sorted Cluster then Node Groups, in alphabetic order. |
|
Node Group |
The node group name. For nodes that do not belong to a node group, node group value will be <cluster-name>-default”. |
|
This is the average number of cores available for your container workloads. This value is determined from the number of hours each node was running in the last 7 days and using that value to calculate how many cores are available on average. |
|
|
Average CPU Utilization (%) |
The average CPU utilization, during the past 7 days of history. This value is weighted by the number of hours that each node in the group ran. The CPU utilization is multiplied by the number of running hours for the node before calculating the average. |
|
Surplus CPUs (Cores) |
The number of surplus cores currently provisioned. The surplus number of CPU cores for the node group, based on how many CPUs are utilized as compared to the total allocatable number of CPUs. If the node type is not one “Compute Optimized", “General Purpose”, or “Memory Optimized” then this value cannot be determined and is indicated as a dash (-). |
|
This is the average amount of memory available for your container workloads. This value is determined from the number of hours each node was running in the last 7 days and using that value to calculate how much memory is available on average. |
|
|
Average Memory Utilization (%) |
The average memory utilization during the past 7 days of history. This value is weighted by the number of hours that each node in the group ran. The memory utilization is multiplied by the number of running hours for the node before calculating the average. |
|
Surplus Memory (GB) |
The amount of surplus memory currently provisioned. The surplus memory of the node group based on how much memory is utilized as compared to the total allocatable amount of memory. If the node type is not one “Compute Optimized", “General Purpose”, or “Memory Optimized” then this value cannot be determined and is indicated as a dash (-). |
|
Primary Constraint |
Indicates the reason that more containers cannot be added to this node group. The following values are evaluated and whichever has the largest value is identified as the primary constraint:
|
|
Current Node Family |
This is the current value. The node is categorized as one of “Compute Optimized", “General Purpose”, or “Memory Optimized”. |
|
Fully Optimized Node Family |
Use this value to determine if your nodes are utilized as efficiently as possible. Both CPU and memory utilization are used to determine this ratio. Additionally, the following factors are taken into consideration when calculating the value.
If the node type is not one “Compute Optimized", “General Purpose”, or “Memory Optimized” then this value cannot be determined and is indicated as a dash (-). |
|
Estimated Waste ($/Month) |
This is the estimated wasted spend per month. If the value is negative your infrastructure may be under-provisioned. Calculated as: Fully Optimized Estimated Cost - Current Estimated Cost If the node type is not one “Compute Optimized", “General Purpose”, or “Memory Optimized” then this value cannot be determined and is indicated as a dash (-). |
|
Total |
The totals at the bottom of the table indicate the total for each column, for all pages, if you have a multi-page report. Vertical scroll bars may be displayed to scroll through the entire list, so lower rows may be momentarily hidden behind the row of Totals. |
Please observe the following for this set of data:
- Missing data is indicated with a dash (-).
- For bare metal cases, 4x16 is indicated as the primary node type. The current cost is determined using $20/core, $5/GB. The cost per core and per GB of memory is configurable. Contact [email protected] for details.
- g4dn.xlarge node group will always show '-' for the fully optimized and surplus columns because it is GPU family and not memory optimized, general purpose or compute optimized. Densify cannot accurately say what is happening there without GPU utilization data.
See the following topics for more details: