Node Group Analysis Tab
Node Group Analysis Tab
#380940
The Node Group Analysis report provides a summary of your node group infrastructure. Visibility into your node groups helps identify resource allocation and configuration issues.
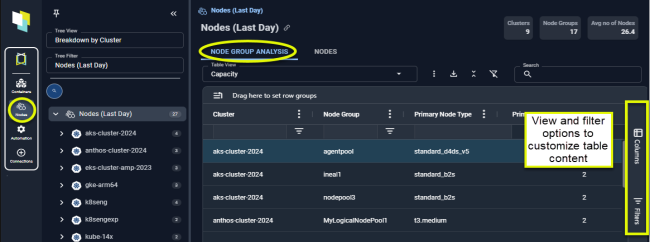
Figure: Locating the Node Group Analysis Tab
The Node Group Analysis page displays key metrics that help you identify nodes that are CPU or memory saturated. Saturated resources can lead to CPU throttling or OOM kills for hosted containers. Imbalances in CPU or memory utilization across nodes may indicate future saturation and lead to performance and stability issues in containers.
|
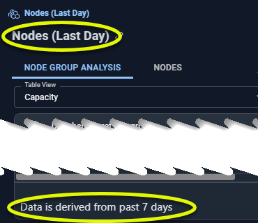
Figure: Last Day vs Last 7 Days |
|
|
|
The Nodes groups discovered in the last day are displayed in the tree viewer. The data for these nodes has been aggregated and analyzed based on the last 7 days of collected data to provide more realistic utilization reports and charts. |
Node group data is displayed in a detailed tabular report, as shown below. You can further drill down to the Nodes page to see utilization details for each of the nodes in the group.
You can create filters at the head of each column or using the flyout menu on the right side of the page. See Using Filters. This report includes all available columns and can be customized to create a tailored view.
Pre-Configured Views
The following pre-configured tables are provided to quickly show various issues in your environment. Specific filters have been set and selected columns are displayed to highlight the specified risk or waste issue.
The following system views provide commonly used reports:
|
System View |
View |
Description |
|---|---|---|
|
Default View |
N/A |
This is the most commonly used set of columns that provide a summary view of your node groups. CPU and memory utilization as a percentage of the total provide a visual indicator of the available capacity. |
|
Capacity |
N/A |
The columns have been selected to show you how effectively your node group resources are being used. |
|
Health |
N/A |
This view focuses the overall health of your nodes. The performance of your node groups affects the containers that are being hosted and can be wasteful if resources are under-allocated. |
|
Waste |
N/A |
The columns have been selected to quickly show wasted resources and money-saving recommendations. |
Node Details Table
The following table describes all of the available columns. The pre-configured views, listed above and the default view contain a subset of these columns. You can enable or disable any one or more of the following columns to create your version of the report.
|
Column Name |
Description |
|---|---|
|
Cluster |
The cluster name containing the node group. By default this table is sorted Cluster then Node Groups, in alphabetic order. |
|
Node Group |
The node group name. For nodes that do not belong to a node group, their node group value will be <cluster-name>-default”. |
|
Primary Node Type |
The most common instance type. For example, if there are 20 r6i.large instances and 10 m6i.large instances, the primary node type is r6i.large. In cases where the instance type cannot be determined (i.e. bare-metal, private cloud environments) the primary node type is indicated as: CPU x memory size, e.g. 8x16. A dash (-) indicates that node instance details could not be determined. |
|
Unique Nodes |
The total number of unique nodes that are part of this node group, during the past 7 days of history. The value of node ID is used to determine if a node is unique. The number listed in this column is a hyperlink that takes you to the Nodes details tab. Only the systems, as indicated by the count in this table cell, are shown on the details page. See the Nodes Tab |
|
Average No. of Nodes |
The average number of nodes in the node group, during the past 7 days of history for in-service instances with non-zero workload. For clusters (i.e. <cluster-name>-default) that are composed of nodes that are not part of a node group, the average number of nodes is calculated as: Total Node Hours/Total Hours in time period (7 days). For example, if there are 20 nodes, that are not part of any node group, and in total there are 200 node hours of utilization, then: 200 node hours/168 hours in 7 days = 1.19 Avg number of nodes. |
|
Total Node Hours |
The cumulative number of hours that all nodes in the group have been up and running, with CPU or memory utilization. |
|
The number of nodes with peak CPU utilization above the saturation threshold (default: 95%), during the past 7 days of history. The saturation threshold value is configurable. Contact [email protected] for details. |
|
|
The percentage of nodes with peak CPU utilization above the configurable, saturation threshold (default: 0%) during the past 7 days of history. The value is expressed as a percentage of the total number of nodes. If the value exceeds the threshold the cell is shaded red. |
|
|
CPU - Node Balance Ratio |
The ratio of the busiest (top 10%) to least busy (bottom 10%) nodes within a node group. Use this value to assess the distribution of CPU resources across the nodes in a cluster. A value of between 1 to 1.5 is ideal. If the ratio exceeds a value of 2 the cell is shaded to clearly indicate that resource allocation should be investigated. This threshold value is configurable. Contact [email protected] for details. |
|
The number of nodes with memory utilization above the saturation threshold, during the past 7 days of history. The saturation threshold value is configurable. Contact [email protected] for details. |
|
|
Nodes with Memory Saturation (%) |
The percentage of nodes with memory utilization above the configurable, saturation threshold (default: 0%) during the past 7 days of history. The value is expressed as a percentage of the total number of nodes. Calculated as: Node hours with saturated memory/total node hours. If the value exceeds the threshold the cell is shaded red. The saturation threshold value is configurable. Contact [email protected] for details. Node Group saturation calculations use working set memory, if available. If working set memory is not available, then (memory_bytes/capacity_memory) is used. |
|
Memory - Node Balance Ratio |
The ratio of the busiest (top 10%) to least busy (bottom 10%) nodes within a node group. Use this value to assess the distribution of memory resources across the nodes in a cluster. A value of between 1 to 1.5 is ideal. If the ratio exceeds a value of 4 the cell is shaded to clearly indicate the resource allocation should be investigated. The threshold value is configurable. Contact [email protected] for details. |
|
No. of Container Manifests |
The number of container manifests in the node group being analyzed during the last analysis run. Only containers that were part of the selected node group AND not part of another node group, in the past 7 days, are counted. |
|
Container Manifests with Restarts - Last Day |
The number of container manifests in this node group with containers that were restarted in the last day. Only containers that were part of the selected node group AND not part of another node group, in the last day, are counted. |
|
Container Manifests with Memory Limit Events - Last Day |
The number of container manifests in the node group which have exceeded the working set memory limit, in the last day.This value is a hyperlink that takes you to the AI Analysis Details page, filtered to show the container manifests, in the selected node group. |
|
Primary Node Type CPU (Cores) |
The total CPU allocation of the primary node/instance type. If a primary node has not been identified use the value of capacity_cpu. |
|
Primary Node Type Memory (GB) |
The total memory allocation of the primary node/instance type. If a primary node has not been identified use the value of capacity_mem, converted to GB. |
|
No. of Nodes at Max Pod Capacity |
The number of nodes in the node group where the peak number of pods that can be run is equal to the number of allocatable pods during the past 7 days of history |
|
This is the average number of cores available for your container workloads. This value is determined from the number of hours each node was running in the last 7 days and using that value to calculate how many cores are available, on average. |
|
|
CPU Request |
The percentage of total allocatable CPU capacity that is already allocated to CPU requests. |
|
Peak CPU Utilization (%) |
The peak CPU utilization of the busiest node in the group. |
|
Average CPU Utilization (%) |
The average CPU utilization, during the past 7 days of history. This value is weighted by the number of hours that each node in the group ran. The CPU utilization is multiplied by the number of running hours for the node before calculating the average. |
|
This is the average amount of memory available for your container workloads. This value is determined from the number of hours each node was running in the last 7 days and using that value to calculate how much memory is available on average. |
|
|
Memory Request (% Capacity) |
The percentage of allocatable memory capacity that is allocated to memory requests. |
|
Peak Memory Utilization (%) |
The peak memory utilization of the busiest node in the node group |
|
Average memory Utilization (%) |
The average memory utilization during the past 7 days of history. This value is weighted by the number of hours that each node in the group ran. The memory utilization is multiplied by the number of running hours for the node before calculating the average. |
|
Primary Constraint |
Indicates the reason that more containers cannot be added to this node group. The following values are evaluated and whichever has the largest value is identified as the primary constraint:
|
|
Primary Node Type CPU (Cores) |
If a primary node type has been defined, then the number of cores is retrieved from the cloud model. Other nodes in node group may have different amounts of memory. If a primary node type has not been defined, use capacity_cpu. |
|
Primary Node Type Memory(GB) |
If a primary node type has been defined, then the number of CPU cores is retrieved from the cloud model. Other nodes in node group may have different numbers of CPUs. If a primary node type is not been defined, use capacity_mem. |
|
Fully Optimized Node Family |
Use this value to determine if your nodes are utilized as efficiently as possible. Both CPU and memory utilization are used to determine this ratio. Additionally, the following factors are taken into consideration when calculating the value.
If the node type is not one “Compute Optimized", “General Purpose”, or “Memory Optimized” then this value cannot be determined and is indicated as a dash (-). |
|
Surplus CPUs (Cores) |
The number of surplus cores currently provisioned. The surplus number of CPU cores for the node group, based on how many CPUs are utilized as compared to the total allocatable number of CPUs. If the node type is not one “Compute Optimized", “General Purpose”, or “Memory Optimized” then this value cannot be determined and is indicated as a dash (-). |
|
Surplus Memory (GB) |
The amount of surplus memory currently provisioned. The surplus memory of the node group based on how much memory is utilized as compared to the total allocatable amount of memory. If the node type is not one “Compute Optimized", “General Purpose”, or “Memory Optimized” then this value cannot be determined and is indicated as a dash (-). |
|
Estimated Waste ($/Month) |
This is the estimated wasted spend per month. If the value is negative your infrastructure may be under-provisioned. Calculated as: Fully Optimized Estimated Cost - Current Estimated Cost If the node type is not one “Compute Optimized", “General Purpose”, or “Memory Optimized” then this value cannot be determined and is indicated as a dash (-). |
|
No. of Container Manifests |
The number of container manifests in the node group being analyzed during last analysis run. Only containers that were part of the selected node group AND not part of another node group, in the past 7 days, are counted. |
|
Total |
The totals at the bottom of the table indicate the total for each column, for all pages, if you have a multi-page report. Vertical scroll bars may be displayed to scroll through the entire list, so lower rows may be momentarily hidden behind the row of Totals. |
GPU Details
The report provides the following additional GPU details for a node group.
|
Column |
Description |
|---|---|
|
No. of Nodes with Underused GPU |
The number of nodes in the selected node group with underutilized GPU capacity, that could be allocated to other containers. |
|
No. of Nodes with Underused GPU (%) |
The percentage of nodes in the selected node group with underutilized GPU capacity, relative to all nodes with allocatable GPU resources. |
|
GPU - Node Balance Ratio |
The ratio of the busiest (top 10%) to least busy (bottom 10%) GPUs within a node group. Use this value to assess the distribution of GPU resources across the nodes in a cluster. A value of between 1 to 1.5 is ideal. If the ratio exceeds a value of 4 the cell is shaded to clearly indicate resource allocation should be investigated. |
|
No. of Nodes with Underused GPU Memory |
The number of nodes in the selected node group with underutilized GPU memory capacity, that could be allocated to other containers. |
|
No. of Nodes with Underused GPU (%) |
The percentage of nodes in the selected node group with underutilized GPU memory capacity, relative to all nodes with allocatable GPU memory resources. |
|
GPU Memory - Node Balance Ratio |
The ratio of the busiest (top 10%) to least busy (bottom 10%) GPUs within a node group. Use this value to assess the distribution of GPU memory resources across the nodes in a cluster. A value of between 1 to 1.5 is ideal. If the ratio exceeds a value of 4 the cell is shaded to clearly indicate resource allocation should be investigated. |
|
Primary Node Type GPUs (GPUs) |
The number of GPUs that is available on the primary node type. |
|
Primary Node Type GPU Memory (GB) |
The amount of GPU memory that is available on the primary node type. |
|
Allocatable GPU (GPUs) |
The node group's available GPU resources that can be allocated to containers. |
|
Average GPU Utilization (%) |
The node group's average GPU utilization. This is an aggregate of the node metrics |
|
Unallocated GPUs (GPUs) |
Available GPU resources that have not been allocated. |
|
Allocatable GPU Memory (MB) |
The available GPU memory that can be allocated to containers. |
|
Peak GPU Memory Utilization (%) |
This is the peak GPU memory usage, as a percentage of the allocated GPU memory value. |
|
Average GPU Memory Utilization (%) |
This is the average GPU memory usage, as a percentage of the allocated GPU memory value. |
Please observe the following for all node data:
- Missing data is indicated with a dash (-).
- A footnote indicates that the data is derived from the past 7 days of history. Nodes appear in the tree viewer immediately after data collection (last day), but values in some columns are based on 7 days of aggregated data.
Utilization Charts
The last section provides utilization charts that show hourly min/max and sustained activity for the selected node group. You can also expand any chart to the modal view and select other metrics for review. See AI Analysis Details Table for details on using these charts to review workload data.
- CPU Utilization (%)
- Memory Utilization (%)
- Actual Memory Utilization (%)
- Number of Nodes