AI Analysis Details - Container Manifest Details View
AI Analysis Details Columns
#380640
A hyperlink in the AI Analysis Details page opens this page showing significant details of the selected container provided in a format that is easier to view and compare compare the current versus the recommended settings.
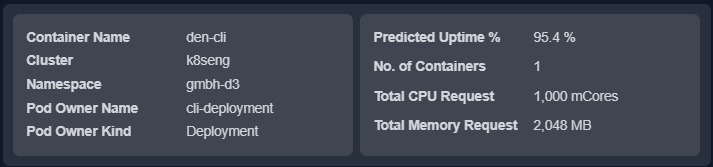
Container Manifest Details
This block lists the container's infrastructure details and current settings. Descriptions for all of these values are provided in the AI Analysis Details table.
Figure: Container Manifest Details
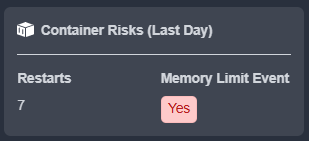
Container Risks (Last Day)
This block indicates details any restarts and memory events that occurred in he past 24hrs.
Figure: Container Risks (Last Day)
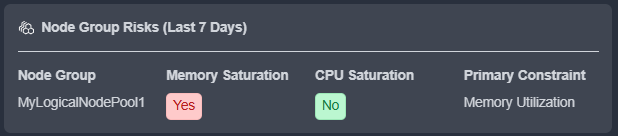
Node Group Risks (Last 7 Days)
This block indicates whether the parent node group is at risk. Memory , CPU saturation and the Primary Constraint are also displayed.
Figure: Node Group Risks (Last 7 Days)
CPU | Memory Request and Limits
These blocks lists the current and recommended allocation settings, based on utilization for the selected container. The values are colour-coded to easily identify savings and wasted resources. A dash (-) indicates no value has been set.
These values are per container if there is more than 1 container defined by the selected manifest
Figure: CPU Request and Limits
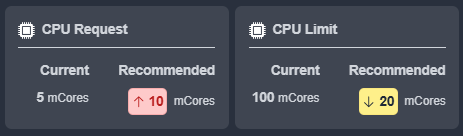
Figure: Memory Request and Limits
Total Surplus/Shortfall Resources
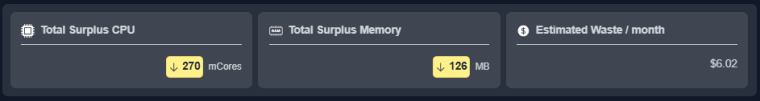
These blocks list the aggregated CPU and memory for the selected manifest. The value is colour-coded to easily identify savings or shortfalls. Wasted spend is listed in the last block. A negative value indicates you need to increase the CPU or memory setting to eliminate risk.
If the selected manifest does not have CPU or memory request values set, additional cards with details of the impact of unspecified values are shown.
Figure: Total Surplus CPU | Memory and Estimated Waste
Utilization Charts
The last section provides utilization charts that show hourly min/max and sustained activity for the selected system. The charts show the current utilization and the recommended limits for the selected workload. See AI Analysis Details Utilization Charts for details on using these charts to review workload data.
|
|
All other metrics are available on the Metrics Viewer Tab tab. You can also expand any chart to the modal view and select other metrics for review.
A link at the bottom of the page takes you to the Summary page for the selected instance.