Optimizing Your Containers - Data Tab
Optimizing Your Containers - Data Tab
#380760
The Kubernetes Container Optimization report provides a summary of optimization opportunities and ways to mitigate risk for your container environments.
Data is displayed as charts on the Summary tab or as detailed tabular data on the Data tab, covered here. There are two additional tabs in the lower pane: Cluster Breakdown and Allocation.
Grouping and Filtering Your Container Data
You can group and filter your data using the following options:
- Group By—See
- Container Filter—See
Filter settings defined using any of the above options are persistent between user login sessions, for this page.
When you export the content of a report with filters applied, the filtered set of systems is exported for the Cluster Breakdown and the Namespace Breakdown tabs.
Note: The functionality is not available on the Kubernetes Details tab.
Key metrics are displayed in a banner at the top of the report. If you have applied filters the totals displayed in this summary reflect the filtered results. The values, in the Summary bar are not affected by the Group By feature. See Reviewing the Summary Tab for details of the key metrics.
These tables provide a few options for managing and viewing your data more effectively. The following controls are applicable to the tables on the Data tab and its sub-tabs Cluster Breakdown and Allocation.
Table: Dashboard Data Controls


By default the table is sorted by Efficiency Rating. This is still the case even if you select another Group By option. You can sort the content of this table using any of the available columns, by clicking the column header.
- Click the column header to sort the table, in ascending order, using the content of the selected column as the sort key.
- Click the column header again, to sort the table, in descending order, again using the content of the selected column as the sort key.
- Click the column header a third time to clear the sort and return to the default, sorted by Efficiency Rating.
An up/down arrow is displayed in the column header to indicate the column is being used to sort the content of the table.
Sorting is not persistent between pages or login sessions and this sorting is available on the Data tab and its contained tabs. i.e. you can also sort the content of the Cluster Breakdown and Allocationtabs.
Viewing the Tabular Data - Top Pane
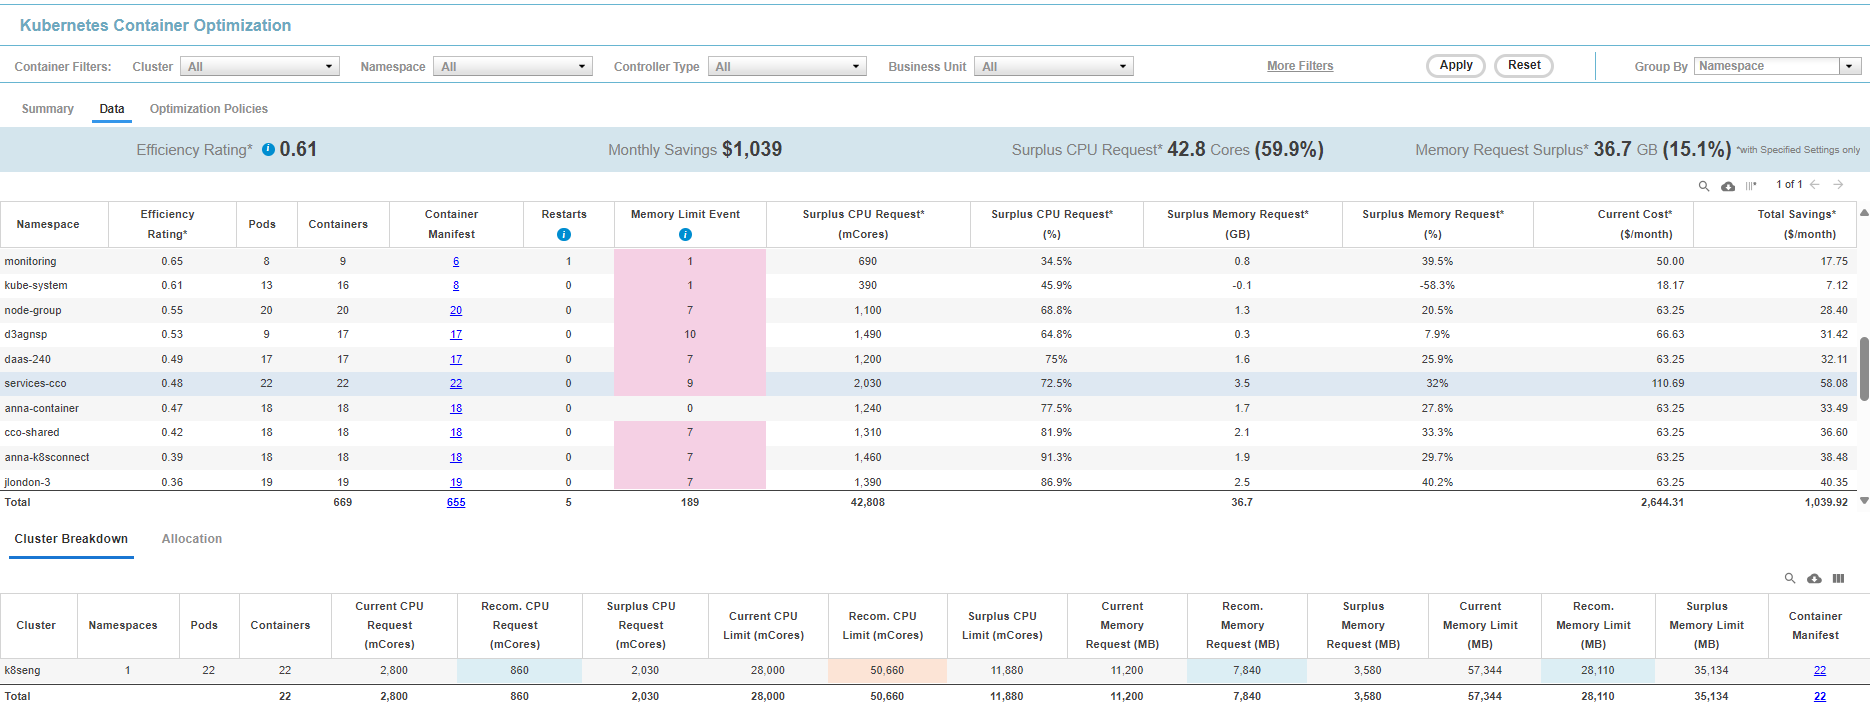
The breakdown of the data for your aggregated container environments is displayed on the top pane of this tab. You can control how the data is displayed in this table using the Group By feature. The Group By setting is used in the first column and data is retrieved and displayed accordingly.
For example, if you wanted to group the data based on Business Unit, Densify displays the analyzed data sorted based on the value of the Business Unit resource tag. See
The top table provides a breakdown as follows:
Table: Kubernetes Container Optimization - Data Tab Columns
|
Column(s) |
Description |
|---|---|
|
Group By selection: Application | |
The first column is determined by your Group By selection. You can control how the data is displayed in this table using the Group By feature. Your Group By selection is used in the first column and data is retrieved and displayed accordingly. See |
|
Efficiency Rating* |
The Efficiency Rating provides an indication of the health of your aggregated environment. The value is indicated in red, when it is greater than 1.
By default, the table is sorted by the Efficiency Rating, in descending order. You can sort the content of the table by any column, by clicking on the column header. The asterisk on this value indicates that containers with unspecified values are not included in this calculation. |
|
Clusters |
The total number of clusters on which the Application | Business Unit | etc. is running. The grouping is defined in the first column. You can change the Grouping options using the Group By feature. This column is hidden by default. You can enable it for display, as required. See Data Controls, above. |
|
Namespaces |
The total number of namespaces on which the Application | Business Unit | etc. is running. The grouping is defined in the first column. If the data is grouped by namespace, then the total number of namespaces with the same name are listed here. Namespaces must be unique within a cluster but you can reuse a name in a different cluster. i.e. you can have a "monitoring" namespace in each of your clusters. This column is hidden by default. You can enable it for display, as required. See Data Controls, above. |
|
Pods |
The total number of pods on which the Application | Business Unit | etc. is running. |
|
Containers |
This is the number of unique containers on which the Application | Business Unit | etc. is running. If the data is grouped by namespace, then the total number of containers with the specified namespace are listed here. |
|
Container Manifest |
This is the number of manifests that reference the Application | Business Unit | etc. The number of instances listed in this column is a hyperlink that takes you to the Kubernetes Container Optimization > Analysis tab, for the selected grouping. i.e. Only the specific systems, as indicated by the count in the originating table cell, are shown on the Kubernetes Container Optimization > Analysis tab. See |
|
Optimal | Identified Risk | Savings Opportunity | Risk and Savings | Size from Unspecified |
These 5 columns provide a breakdown by recommendation type.
The number of instances listed in this column is a hyperlink that takes you to the Kubernetes Container Optimization > Analysis tab, for the selected grouping. i.e. Only the specific systems, as indicated by the count in the originating table cell, are shown on the Kubernetes Container Optimization > Analysis tab. See Values are colour-coded for improved readability. Colour coding is listed in Container Optimization Types. This column is hidden by default. You can enable it for display, as required. See Data Controls, above. |
|
Percent Optimal (%) |
This is the percentage of total containers that are sized correctly. (Optimal Count /Total Systems) This column is hidden by default. You can enable it for display, as required. See Data Controls, above. |
|
Restart |
The total number of restarts of all containers asociated with the deployment, in the last 7 days. A dash (-) is displayed if no data has been collected. |
|
Memory Limit Event |
Indicates if the peak working set memory utilization was near or exceeded the memory limit in the last 7 days. A value of "No" indicatates:
|
|
Surplus CPU Request(Cores)* |
This is the number of surplus CPU cores for the selected Application | Business Unit | etc. Calculated as (Current CPU Request - Recommended CPU Request) The asterisk on this value indicates that containers with unspecified values are not included in this calculation. |
|
Surplus CPU Request (%)* |
This is the number of surplus CPU cores for the selected Application | Business Unit | etc. expressed as percentage. Calculated as (Surplus CPU Request/Current CPU Request)*100 The asterisk on this value indicates that containers with unspecified values are not included in this calculation. |
|
Surplus Memory Request (GB)* |
This is the amount of surplus memory for the selected Application | Business Unit | etc. Calculated as (Current Memory Request - Recommended Memory Request) The asterisk on this value indicates that containers with unspecified values are not included in this calculation. This column is hidden by default. You can enable it for display, as required. See Data Controls, above. |
|
Surplus Memory Request (%)* |
This is the amount of surplus Memory for the selected Application | Business Unit | etc. expressed as percentage. Calculated as (Surplus Memory Request/Current Memory Request)*100 The asterisk on this value indicates that containers with unspecified values are not included in this calculation. |
|
Current Cost ($/month)* |
The estimated cost is the aggregate cost of all of the services in the selected account, as indicated by Total Services for each row. The asterisk on this value indicates that containers with unspecified values are not included in this calculation. |
|
Net Savings ($/month) * |
If the recommendations are implemented, the net savings indicated here can be achieved. This value is calculated as the current estimated cost minus the estimated cost of the recommended instances. The asterisk on this value indicates that containers with unspecified values are not included in this calculation. |
|
Total |
The totals at the bottom of the table indicate the total for each column, for all pages, if you have a multi-page report. Vertical scroll bars may be displayed to scroll through the entire list, so lower rows may be momentarily hidden behind the row of Totals. This count is a hyperlink that takes you to the K page for the selected grouping. i.e. Only the specific systems, as indicated by the count in the originating table cell, are shown in the Kubernetes Container Optimization Details page. For more information, see |
Cluster Breakdown Tab - Lower Pane
The details, of the row selected in the top pane, are expanded and displayed on two tabs on the lower pane.
The Cluster Breakdown tab provides a subset of the information from the top of the page, for only the selected row, expanded by Cluster and sorted by cluster name.
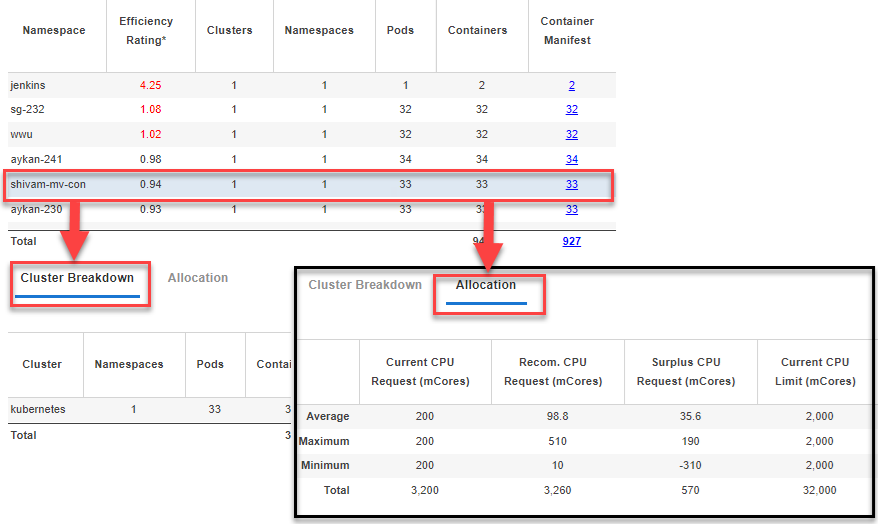
Table: Columns in the Cluster Breakdown Tab
|
Column |
Description |
|---|---|
|
Cluster |
This is the name of the cluster. |
|
Namespaces |
This is the number of unique namespaces in the cluster that are within the grouped selection. |
|
Pods |
This is the number of unique pods within the grouped selection. |
|
Containers |
This is the number of unique containers based on the grouped selection. |
|
Current CPU Request (mCore) |
This is the aggregated total current CPU request for the containers in the selected cluster. Containers with unspecified CPU or memory requests and/or limit values are indicated with a dash (-). |
|
Recommended CPU Request (mCore) |
This is the aggregated total CPU Request recommended for the containers in the selected cluster. Values are colour-coded for improved readability. Colour coding is listed in Container Optimization Types. |
|
Surplus CPU Request (mCore) |
This is the aggregated total CPU request surplus. This value can be negative (at risk) or a positive value. |
|
Current CPU Limit (mCore) |
This is the aggregated total current specified CPU limit for the containers in the selected cluster. Containers with unspecified CPU or memory requests and/or limit values are indicated with a dash (-). |
|
Recommended CPU Limit (mCore) |
This is the aggregated total CPU limit recommended for the containers in the selected cluster. Values are colour-coded for improved readability. Colour coding is listed in Container Optimization Types. |
|
Surplus CPU Limit (mCore) |
This is the aggregated total CPU limit surplus for the selected cluster. This value is calculated as (Current CPU limit - Recommended CPU limit) * Current Count) of the filtered records. Containers with unspecified CPU or memory requests and/or limit values are indicated with a dash (-). |
|
Current Memory Request (MB) |
This is the aggregated total current memory request for the containers in the selected cluster. Containers with unspecified CPU or memory requests and/or limit values are indicated with a dash (-). |
|
Recommended Memory Request (mCore) |
This is the aggregated total memory request recommended for the containers in the selected cluster. Values are colour-coded for improved readability. Colour coding is listed in Container Optimization Types. |
|
Surplus Memory Request (mCore) |
This is the aggregated total memory request surplus. This value is calculated as (Current Memory Request - Recommended CPU | Memory Request) * Current Count) of the filtered records. Containers with unspecified CPU or memory requests and/or limit values are indicated with a dash (-). |
|
Current Memory Limit (MB) |
This is the aggregated total current specified memory limit for the containers in the selected cluster. Containers with unspecified CPU or memory requests and/or limit values are indicated with a dash (-). |
|
Recommended Memory Limit (MB) |
This is the aggregated total memory limit recommended for the containers in the selected cluster. Values are colour-coded for improved readability. Colour coding is listed in Container Optimization Types. |
|
Surplus Memory Limit (MB) |
This is the aggregated total surplus memory limit. This value is calculated as (Current Memory limit - Recommended Memory limit) * Current Count) of the filtered records. Containers with unspecified CPU or memory requests and/or limit values are indicated with a dash (-). |
|
Container Manifest |
This is the number of manifests that reference the specified cluster etc. The number of instances listed in this column is a hyperlink that takes you to the Kubernetes Container Optimization > Analysis tab, for the selected grouping. i.e. Only the specific systems, as indicated by the count in the originating table cell, are shown on the Kubernetes Container Optimization > Analysis tab. See |
The allocation details of the row, selected in the top table is expanded and displayed on this tab in the lower part of the page. The Allocation tab provides a subset of the information shown at the top of the page, but only for the selected row.
Based on the row selected in the top table, the following values are calculated:
- Average—for the selected row the average is calculated as (total / # of containers);
- Maximum—The maximum value of all the items for the selected row;
- Minimum—The minimum value of all the items for the selected row;
- Total—The total values of all the items for the selected row.
Calculations only include containers where a request or limit value has been specified.
Table: Columns in the Allocation Tab
|
Column(s) |
Description |
|---|---|
|
Current | Recommended CPU Request | Limit |
These 4 columns indicate the current and recommended CPU requests and limits. The average, maximum, minimum and total values are shown for the containers in the selected row. |
|
Surplus CPU Request | Limit |
These 2 columns indicate the surplus or deficit CPU requests and limits. If this is an identified risk recommendation the value may be negative indicating that additional resources are required for this cluster. This value is calculated as (Current vCPU request | limit - Recommended vCPU request | limit) * Current Count) of the filtered records. Systems with a 'Terminate' recommendation, are excluded from the calculation in the 'Recommended' columns. If all of the systems in the group have a 'Terminate' recommendation, the values in Recommended columns will be indicated as a dash (-). Containers with unspecified CPU or memory requests and/or limit values are indicated with a dash (-). |
|
Current | Recommended Memory Request | Limit |
These 4 columns indicate the current and recommended memory requests and limits. The average, maximum, minimum and total values are shown for the containers in the selected row. |
|
Surplus Memory Request | Limit |
These 2 columns indicate the surplus or deficit memory requests and limits. If this is an identified risk recommendation the value will be negative indicating that additional resources are required for this cluster. Containers with unspecified CPU or memory requests and/or limit values are indicated with a dash (-). |
|
Predicted Uptime (%) |
The predicted uptime (%) for a container is based on the percentage of hours that CPU utilization data is present in the historical interval, that is specified in the policy settings. |
|
# of Containers |
The number of containers on which the reported data is based. |
|
# of Nodes |
The number of nodes on which the containers are running . |
Please observe the following for this set of data:
- Systems with missing data are excluded from the calculations;
- If there is no data or values are unspecified for a whole group of systems, this is indicated as a dash (-);